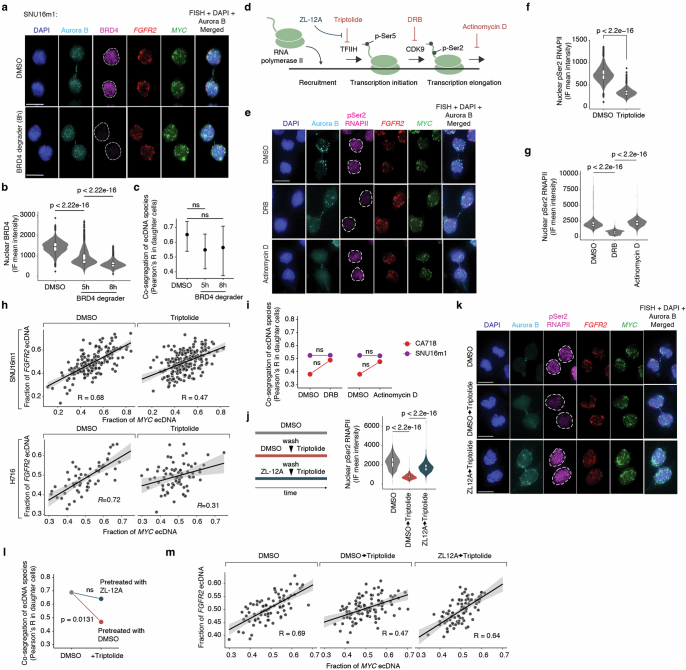
Extended Data Fig. 7. Active transcription initiation promotes coordinated inheritance of ecDNA species.
(a) Representative image of immunofluorescence (IF)-DNA-FISH staining for simultaneous labelling of Aurora kinase B protein marking dividing daughter cells, BRD4 protein, FGFR2 ecDNA and MYC ecDNA in SNU16m1 cells treated with a BRD4 degrader at 1 µM or DMSO (control) for 8 h. White dashed line marks the nuclear boundary. Scale bars, 10 µm. (b-c) BRD4 protein level and corresponding changes in co-segregation of ecDNA species upon BRD4 degrader treatment in SNU16m1 cells. (b) Violin plot showing nuclear BRD4 IF mean intensity scores of SNU16m1 interphase cells treated with DMSO (n = 2774 cells) or BRD4 degrader for 5 h (n = 2030 cells) or 8 h (n = 2338 cells). P-values computed with a two-sided Wilcoxon rank-sums test. Box center line, median; box limits, upper and lower quartiles; box whiskers, 1.5× interquartile range. (c) Levels of co-segregation of FGFR2 and MYC ecDNA quantified by Pearson’s R between the two ecDNA species in dividing SNU16m1 daughter cells and the respective mean nuclear BRD4 IF intensities (DMSO, n = 128 cells; BRD4 degrader: 5 h, n = 139 cells; 8 h, n = 67 cells). Statistical significance was computed using Fisher’s z-transformation and one-sided hypothesis testing. Error bars show Zou’s 95% confidence intervals. ns, not significant. While the mean correlation coefficients are not statistically significant, the increased confidence interval with dBRD4 treatment suggests increased variance in ecDNA co-segregation. (d) A schematic diagram of transcription initiation and elongation which can be blocked by various chemical compounds. (e) Representative images of immunofluorescence-DNA-FISH staining for Aurora kinase B protein marking dividing daughter cells, active pSer2 RNAPII, FGFR and MYC ecDNA, and DNA staining by DAPI in SNU16m1 cells treated with DMSO (control), DRB (200 µg/mL) or actinomycin D (5 µg/mL) for 3 h. (f) Violin plot showing levels of active nuclear RNA Polymerase II with serine 2 phosphorylation (pSer2 RNAPII) in SNU16m1 interphase cells treated with DMSO (n = 3325 cells) or 10 µM triptolide (n = 2596 cells) for 3.5 h (p < 2.2e-16). P-value computed with a two-sided Wilcoxon rank-sums test. Box center line, median; box limits, upper and lower quartiles; box whiskers, 1.5× interquartile range. (g) Violin plot showing levels of active pSer2 RNAPII in SNU16m1 interphase cells treated with DMSO (n = 3401 cells), 200 µg/mL DRB (n = 1696 cells) or 5 µg/mL actinomycin D (n = 1371 cells) for 3 h (p < 2.2e-16 for DMSO vs DRB and DRB vs actinomycin D). P-values computed with a two-sided Wilcoxon rank-sums test. Box center line, median; box limits, upper and lower quartiles; box whiskers, 1.5× interquartile range. (h) Scatter plots showing per-cell ecDNA contents containing the indicated oncogene sequences of daughter cells in SNU16m1 and H716 after treatment with DMSO or 10 µM triptolide for 3.5 h (Pearson’s R; error bands represent 95% confidence intervals. DMSO-treated H716 data was also shown in Fig. 2d). (i) Pairwise comparisons of ecDNA co-segregation quantified by Pearson’s R between DMSO control and 200 µg/mL DRB or 5 µg/mL actinomycin D treatments for 3 h in SNU16m1 cells with MYC and FGFR2 ecDNAs (DMSO, n = 86 daughter cell pairs; actinomycin D, n = 49 daughter cell pairs; DRB, n = 72 daughter cell pairs) or CA718 cells with PDGFRa and MYCN ecDNAs (DMSO, n = 60 daughter cell pairs; actinomycin D, n = 50 daughter cell pairs; DRB, n = 61 daughter cell pairs). Fisher’s z-transformation, one-sided test. (j) Left: Experimental schematic of cell treatments with DMSO or triptolide after pre-treatments with DMSO or ZL-12A, an antagonist of triptolide. Right: Violin plot showing levels of active pSer2 RNAPII in SNU16m1 interphase cells treated with DMSO (n = 1567 cells) for 6.5 h, or 10 µM triptolide for 3.5 h after pre-treatment of DMSO (n = 1467 cells) or 50 µM ZL-12A (n = 1135 cells) for 3 h. P-values computed with a two-sided Wilcoxon rank-sums test. Box center line, median; box limits, upper and lower quartiles; box whiskers, 1.5× interquartile range. (k) Representative images of immunofluorescence-DNA-FISH staining for Aurora kinase B protein marking dividing daughter cells, active pSer2 RNAPII, FGFR and MYC ecDNA, and DNA staining by DAPI in SNU16m1 cells with DMSO (n = 82 daughter cell pairs) for 6.5 h, or 10 µM triptolide for 3.5 h after pre-treatment of DMSO (n = 101 daughter cell pairs) or 50 µM ZL-12A (n = 81 daughter cell pairs) for 3 h. White dashed line marks the nuclear boundary. Scale bars, 10 µm. (l) Pairwise comparisons of ecDNA co-segregation quantified by Pearson’s R between DMSO for 6.5 h (n = 82 daughter cell pairs) and 10 µM triptolide for 3.5 h after pre-treatment with DMSO (n = 101 daughter cell pairs) or pre-treatment with 50 µM ZL-12A (n = 81 daughter cell pairs) for 3 h in SNU16m1 cells with MYC and FGFR2 ecDNAs. Fisher’s z-transformation, one-sided test. (m) Per-cell ecDNA contents containing the indicated oncogene sequences of daughter cells in SNU16m1 after treatment with DMSO for 6.5 h or 10 µM triptolide for 3.5 h after pre-treatment with DMSO or pre-treatment with 50 µM ZL-12A for 3 h (Pearson’s R; error bands represent 95% confidence intervals).

