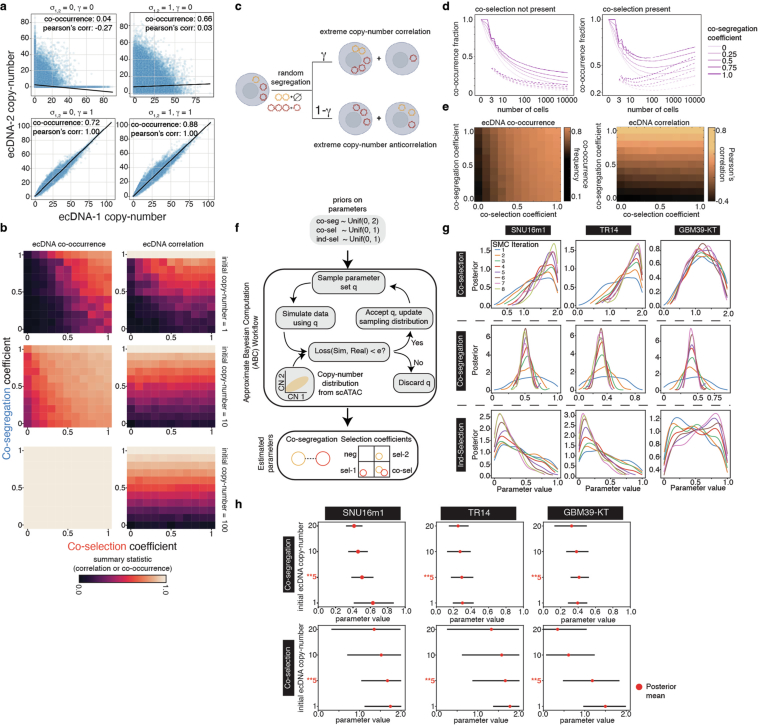
Extended Data Fig. 8. Additional analysis of evolutionary modelling of ecDNA.
(a) Representative joint ecDNA copy-number distributions across varying levels of co-segregation and co-selection. Co-occurrence frequency and Pearson’s correlation are reported for each joint distribution. (b) Average frequency of cells carrying both ecDNA species and Pearson’s correlation of ecDNA copy-numbers in single cells are reported across simulations of 10 replicates of 1 million cells for varying initial ecDNA copy-numbers: 1 copy of each ecDNA species; 10 copies of each ecDNA species; 100 copies of each ecDNA species. Selection acting on cells with only one but not both ecDNA species is maintained at 0.2 and selection acting on cells without either ecDNA is maintained at 0.0 for all simulations. (c) A schematic illustrating an alternative model of ecDNA evolution, parameterized by selection acting on cells carrying no, both, or either ecDNA as well as a co-segregation parameter . (d) Frequency of cells carrying both ecDNA species reported as a function of number of cells during a simulation for variable levels of co-segregation and with or without co-selection. (e) Average frequencies of cells carrying both ecDNA species and the Pearson’s correlation of ecDNA copy numbers across 500 replicates of simulations of 10,000 cells while varying co-selection and co-segregation values. (f) Schematic of ABC inference workflow: posterior distributions over parameters are inferred from user-defined priors and observed single-cell copy-number data using sequential model fitting on our evolutionary model. (g) Posterior distributions of co-selection, co-segregation, and individual selection values for inferences in SNU16m1, TR14, and GBM39-KT across sequential iterations of Approximate Bayesian Inference Sequential Monte Carlo (ABC-SMC). (h) 95% credible interval of inferred co-segregation and co-selection values from ABC-SMC across the cell lines studied in this report with variable initial ecDNA copy numbers (1, 5, 10, 20). Mean of ABC-SMC-inferred posterior is reported for each 95% credible interval. The initial ecDNA copy number (5) used in the main text is highlighted in red. For simulations in (g-h) populations of 500,000 cells were simulated until the ABC-SMC procedure converged (target error of 0.05) or time limit of 3 days elapsed (Methods).

