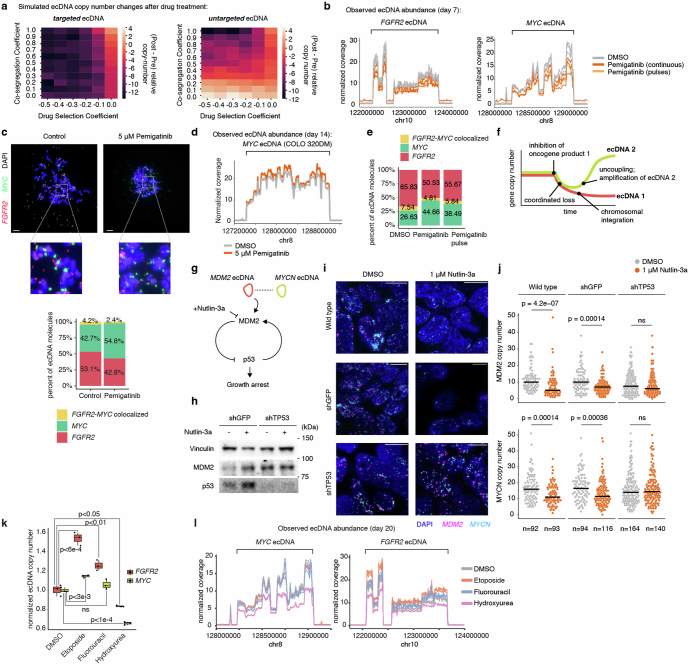
Extended Data Fig. 10. Characterization of pharmacological effects on ecDNA copy numbers.
(a) Simulated changes in copy number after targeted treatment for the ecDNA directly or indirectly being targeted under various parameters of co-segregation and drug selection. 500,000 cells were simulated, and average values were reported across 10 replicates. (b) WGS coverage of FGFR2 and MYC ecDNA genomic intervals after seven days of pemigatinib treatment at 5 µM compared to DMSO control. (c) Representative metaphase DNA FISH images showing distinct FGFR2 and MYC ecDNA species in SNU16m1 cells after 20 days of treatment with 5 µM pemigatinib (top), and quantification of distinct and colocalized FGFR2-MYC DNA FISH signals (bottom). Control, n = 60 cells; pemigatinib, n = 58 cells. Scale bars, 10 µm. (d) WGS coverage of MYC ecDNA genomic interval in COLO 320DM cells after 14 days of treatment with 5 μM pemigatinib compared to DMSO control. (e) Quantification of distinct and colocalized FGFR2-MYC DNA FISH signals in metaphase DNA FISH images of FGFR2 and MYC ecDNA species in SNU16m1 cells after 42 days of treatment with 5 µM pemigatinib or DMSO control. (f) Schematic of copy number changes of co-segregating ecDNA species under selective pressure. (g) Schematic of the inhibition of MDM2 as part of the p53 pathway. (h) Western blot analysis of TR14 cells with small hairpin RNA targeting either GFP (shGFP) or TP53 (shTP53) with or without 1 μM nutlin-3a treatment. (i) Representative images of DNA FISH on interphase wild-type TR14 cells and cells with shGFP or shTP53 treated with 1 µM nutlin-3a or DMSO for 6 days (for DMSO treatments: wild-type, n = 92 cells; shGFP, n = 94 cells; shTP53, n = 164 cells; for nutlin-3a treatments: wild-type, n = 93 cells; shGFP, n = 116 cells; shTP53, n = 140 cells). Scale bars, 5 µm. (j) Copy numbers of MDM2 and MYCN ecDNAs in wild-type TR14 cells, cells with shGFP or shTP53 after 6 days of 1 μM nutlin-3a or DMSO control treatment (p-values computed with a two-sided Wilcoxon rank-sums test). Each dot represents an individual cell (n represents number of cells in each condition) and horizontal lines show medians. (k) Copy-numbers of MYC and FGFR2 in SNU16m1 cells after 20 days of treatment of DMSO control, 10 μM etoposide, 20 μM fluorouracil, or 100 μM Hyrdoxyurea. Biological replicates are shown as individual dots in the boxplots (n = 3 replicates for each sample). Statistical significance was assessed using a two-sided t-test (for FGFR2: p < 6e−4 for etoposide, p < 0.01 for fluorouracil, p < 0.05 for hydroxyurea; for MYC: p < 3e-3 for etoposide, n.s. for fluorouracil, p < 1e-4 for hydroxyurea). Boxplots show the quartiles of the distribution, centres indicate distribution median, and whiskers extend to 1.5x the interquartile range. (l) WGS coverage of MYC and FGFR2 ecDNA genomic interval in SNU16m1 cells after 20 days of treatment with DMSO control, 10 μM etoposide, 20 µM fluorouracil, or 100 µM hydroxyurea.

