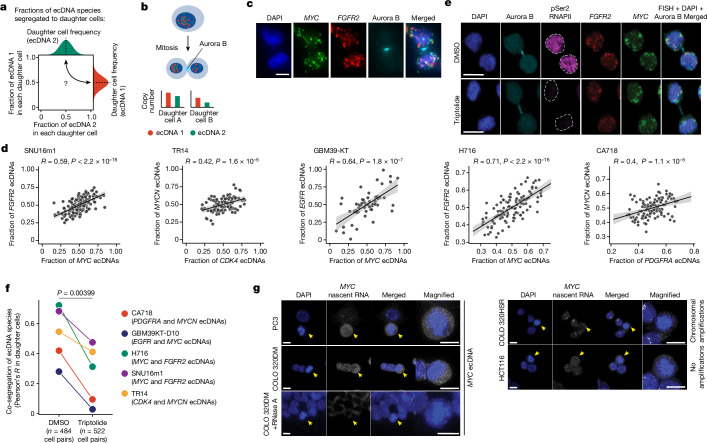
Fig. 2. Distinct ecDNA species are co-segregated into daughter cells during mitosis.
a, Individual ecDNA species are randomly inherited by daughter cells but their joint inheritance is unknown. b, Daughter cell pairs undergoing mitosis were identified by immunofluorescence for Aurora kinase B (Aurora B). Individual ecDNAs were quantified using sequence-specific FISH probes. c, Representative images of pairs of SNU16m1 daughter cells undergoing mitosis. n = 164 cells. Scale bars, 5 µm. d, Per-cell ecDNA contents in daughter cells of cancer cell lines (two-sided Pearson’s R; SNU16m1, P < 2.2 × 10⁻¹⁶; TR14, P = 1.6 × 10⁻⁵; GBM39-KT, P = 1.8 × 10⁻⁷; H716, P < 2.2 × 10⁻¹⁶; CA718, P = 1.1 × 10⁻⁵). H716 and CA718 were treated with DMSO for 3.5 h. The error bands represent the 95% confidence intervals. e, Representative images of immunofluorescence–DNA-FISH staining for Aurora kinase B protein, marking dividing daughter cells and active RNA polymerase II with serine 2 phosphorylation (pSer2 RNAPII), and FGFR2 and MYC ecDNA in SNU16m1 cells treated with 10 µM triptolide (n = 206 cell pairs) or DMSO control (n = 177 cell pairs) for 3.5 h. The white dashed line indicates the nuclear boundary. Scale bars, 10 µm. f, Co-segregation of ecDNA species (Pearson’s R) in DMSO (control) and triptolide (10 µM) treatments for 3.5 h across cancer cell lines. P values were calculated using one-sided Fisher’s z-transformation for both individual cell lines and paired t-test for all cell lines. g, Representative images of intron RNA-FISH images detecting MYC intron 2 as a readout for nascent transcription in cell lines with MYC amplified on ecDNA (PC3, COLO 320DM), chromosomes (COLO 320HSR) or no MYC amplification (HCT116). n = 37 (PC3), n = 37 (COLO 320DM), n = 19 (COLO 320DM with RNase A), n = 41 (COLO 320HSR) and n = 38 (HCT116) cells. An RNase-A-treated negative control shows loss of intron RNA-FISH signal. The yellow arrows indicate mitotic cells with condensed chromatin. Scale bars, 10 µm.

