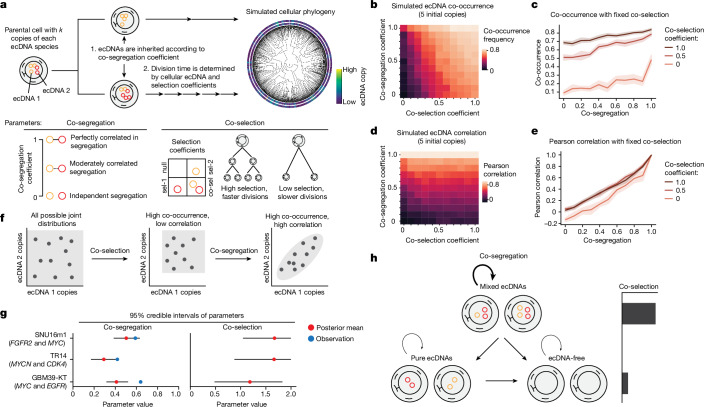
Fig. 3. Evolutionary modelling of ecDNA dynamics reveals the principles of ecDNA co-inheritance.
a, The evolutionary modelling framework used in this study. Cancer populations are simulated starting from a single parent cell carrying a user-defined set of distinct ecDNA species (here, we simulated 2 species) and user-defined initial copy numbers. Cells divide according to a fitness function, parameterized by user-defined selection coefficients. During cell division, ecDNA is inherited according to a co-segregation coefficient. b–e, Summary statistics of 1-million-cell populations and ten replicates across varying co-selection and co-segregation coefficients beginning with a parental cell with five copies of each ecDNA species. The average frequency of cells carrying both ecDNA species (b) and the Pearson correlation of ecDNA copy number within cells (d) are shown across all simulations. The mean frequency of cells carrying both ecDNA species (c) and Pearson correlation of ecDNA copy number within cells (e) are shown as a function of the co-segregation level for the following fixed levels of co-selection: 0.0, 0.5 and 1.0. The shaded area represents the 95% confidence interval across the experimental replicates. Selection acting on cells carrying one but not both ecDNAs is maintained at 0.2 and selection acting on cells without either ecDNA is maintained at 0.0 across all of the simulations. f, Schematic of the effects of co-selection and co-segregation on the joint distribution of ecDNA copy numbers in cancer cells. g, The 95% credible interval for inferred co-segregation and co-selection values for SNU16m1, TR14 and GBM39-KT cell lines. h, Conceptual summary of ecDNA co-evolutionary dynamics.

