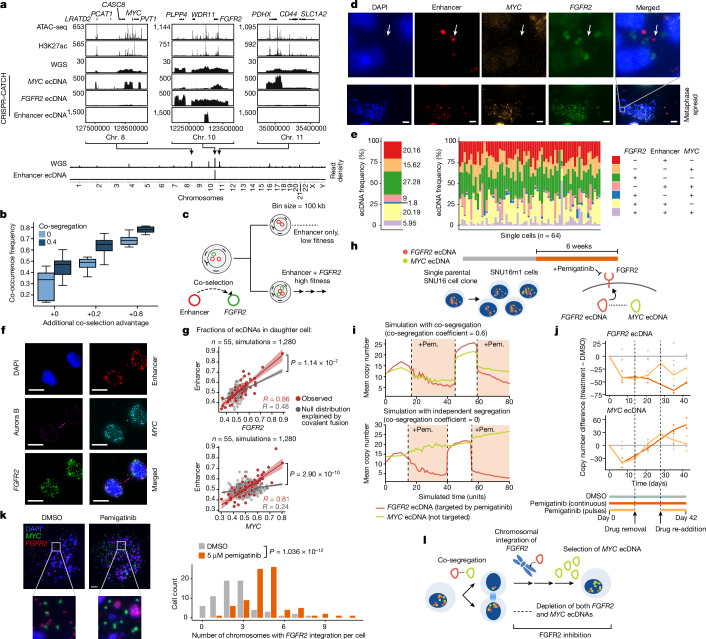
Fig. 4. Specialization and therapeutic remodelling of ecDNA species.
a, From top to bottom, ATAC-seq; H3K27ac ChIP–seq (chromatin immunoprecipitation followed by sequencing); WGS; CRISPR–CATCH sequencing of indicated ecDNAs in SNU16 cells; whole-genome read density plots of WGS and CRISPR–CATCH sequencing of enhancer ecDNA. b, Simulated co-occurrence of FGFR2 and enhancer-only ecDNAs. Co-selection advantage is additive on cells carrying only FGFR2 ecDNA. The box plots show the median (centre line), upper and lower quartiles (box limits), and 1.5× interquartile range (whiskers). n = 1,000,000 cells per 10 replicates per parameter set. c, Co-selection of enhancer ecDNA with FGFR2 ecDNA. d,e, Representative metaphase DNA-FISH images of SNU16 cells targeting enhancer, MYC and FGFR2 sequences (n = 64 cells) (d), and quantification of ecDNA frequencies (e). For d, scale bars, 10 µm. White arrows indicate an enhancer-only ecDNA species. f, Representative images of SNU16 mitotic cells identified by immunofluorescence for Aurora kinase B (n = 55 cell pairs). Individual ecDNAs were visualized using sequence-specific FISH probes. Scale bars, 10 µm. Enhancer DNA-FISH probe (hg19): chromosome 10: 123023934–123065872 (WI2-2856M1). g, Correlations of ecDNA species in one of each daughter cell pair compared to the simulated null distribution explained by covalent fusion (Pearson’s R; P values for the observed correlations compared with the null distributions were calculated using Fisher’s z-transformation and two-sided test). The error bands represent the 95% confidence intervals. h, FGFR2 inhibition with pemigatinib (pem.) in SNU16m1 cells. i, ecDNA copy numbers in simulated pemigatinib inhibition with or without co-segregation; drug decreases selection and co-selection values (−0.1 for cells carrying at least one copy of FGFR2). j, The copy-number difference of FGFR2 and MYC ecDNAs in SNU16m1 cells with continuous or pulsed pemigatinib treatment compared with treatment with DMSO. k, Representative metaphase DNA-FISH images of SNU16m1 cells treated with pemigatinib (n = 81 cells) or DMSO (n = 66 cells) for 6 weeks (left). Right, quantification of chromosomes with FGFR2 integration from metaphase spreads. Statistical analysis was performed using two-sided Wilcoxon rank-sum tests. Scale bars, 10 µm. l, Schematic of genomic changes under pemigatinib selection.

