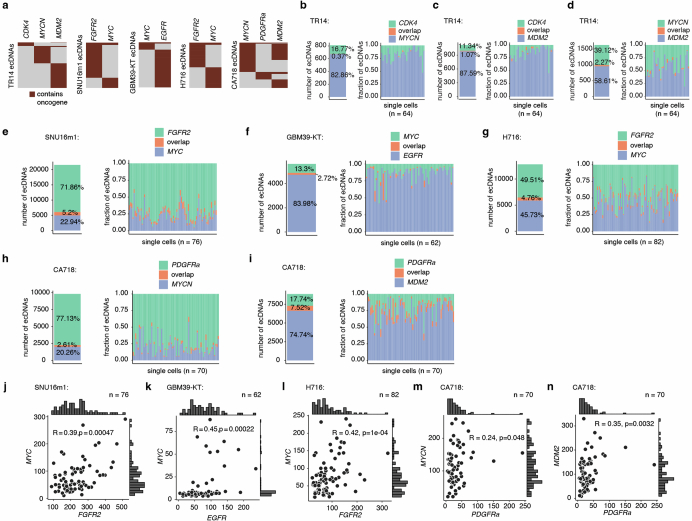
Extended Data Fig. 2. Oncogenes are harboured on distinct ecDNA species but are correlated in copy number.
(a) Heatmaps showing non-overlapping oncogene presence on distinct ecDNA species in metaphase DNA FISH. Rows represent individual ecDNA molecules. (b-d) Bar plots showing the fractions of ecDNAs containing combinations of MYCN, CDK4 or MDM2 and demonstrating little overlap between these oncogenes on the same ecDNA molecules. (e-n) Covalent linkage and copy-number correlations between distinct ecDNA species in metaphase DNA FISH images of various cell lines. Bar plots showing the fractions of ecDNAs containing combinations of FGFR2 and MYC in SNU16m1 cells (e), MYC and EGFR in GBM39-KT cells (f), MYC and FGFR2 in H716 cells (g), and MYCN, PDGFRa and MDM2 in CA718 cells (h,i). Copy number correlations and distributions of FGFR2 and MYC ecDNAs in SNU16m1 cells (j), MYC and EGFR in GBM39-KT cells (k), MYC and FGFR2 in H716 cells (l), and MYCN, PDGFRa and MDM2 in CA718 cells (m,n). Spearman correlations, two-sided test in (j-n).

