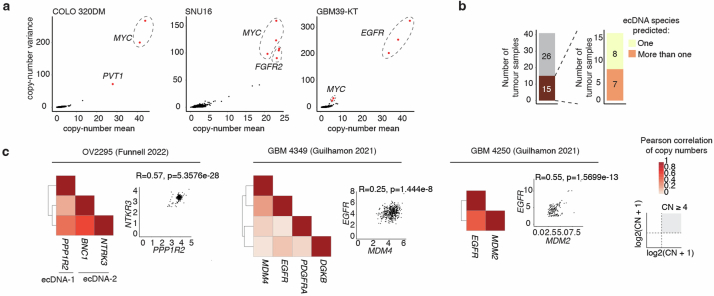
Extended Data Fig. 4. Inferring ecDNA amplifications and co-occurrence from single-cell copy-number data.
(a) Mean and variance of copy-number distribution of 3-Mb genomic windows in three cell lines with validated ecDNA amplifications. Intervals with mean copy-number ≥ 4 and variance/mean ratio ≥ 2.5 were predicted as carrying ecDNA and highlighted in red. Known ecDNA amplifications are annotated onto predicted ecDNA intervals. (b) Number of samples predicted as carrying one or more ecDNA species in three public scATAC-seq and scDNA-seq datasets. (c) Pearson correlation heatmaps and representative scatter plots for samples predicted to carry more than one ecDNA species in (b). Two-sided p-values are reported for Pearson correlations. Correlations are reported across genes predicted to be on ecDNA, only considering CN ≥4 to focus on cells with co-amplification, and log2(1+x) copy numbers are reported for representative scatter plots.

