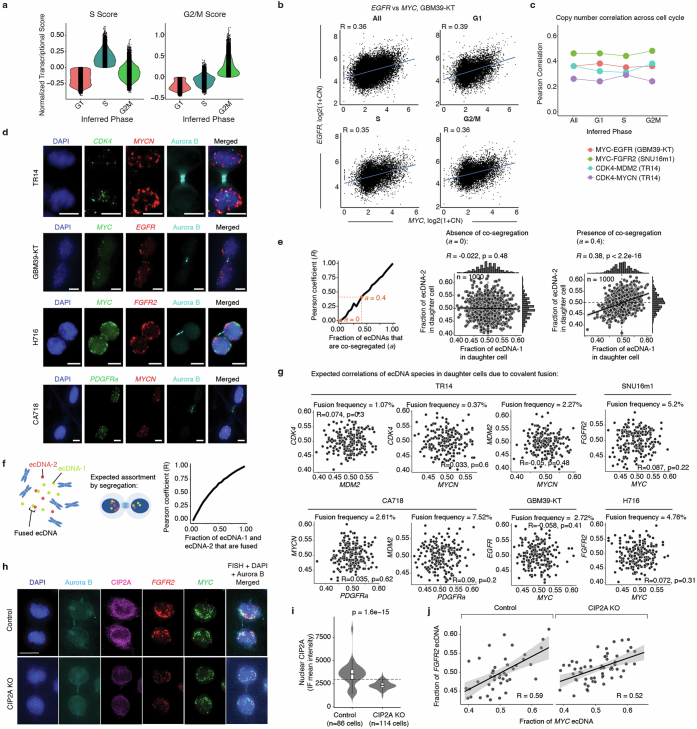
Extended Data Fig. 5. ecDNA co-inheritance is not explained by hyper-replication, covalent fusion, or CIP2A mitotic tethering.
(a) Distribution of S phase and G2M phase transcriptional signatures across inferred cell cycle phases across cells profiled with paired scATAC-seq and RNA-seq (n = 71,804 cells). (b) Scatter plot of MYC and EGFR copy-number correlations overall and across inferred cell phases for GBM39-KT. Each dot is a single cell; Pearson correlations are reported for each grouping. (c) Summary of copy-number Pearson correlations for pairs of ecDNA genes in GBM39-KT, SNU16m1, and TR14 overall and across cell cycle phases. (d) Representative images of pairs of daughter cells undergoing mitosis. Scale bars, 5 µm. (e) Segregation of two ecDNA species with 100 copies each was simulated by random sampling with varying levels of co-segregation (1000 simulations per co-segregation fraction a; Methods). As the fraction (a) of ecDNAs that are co-segregated increases from 0.00 (no co-segregation) to 1.00 (each copy of one ecDNA species is perfectly co-segregated with a copy of another species) in increments of 0.05, the Pearson coefficient R of the copy numbers of two ecDNA species in individual daughter cells increases linearly (left panel). Thus, in the absence of co-segregation, no copy number correlation in mitotic daughter cells is expected (middle panel), while in the presence of a modest level of co-segregation (a fraction of 0.4, or 40% of one ecDNA species co-segregating with 40% of another), a Pearson coefficient R of 0.38 is expected (right panel). Two-sided test was used to calculate significance. (f) Segregation of two ecDNA species with 100 copies each was simulated by random sampling with varying frequencies of covalent fusion (from 0.00 to 1.00 with increments of 0.05; 5000 simulations per fusion frequency; Methods). Left panel shows resulting Pearson’s R in dividing daughter cells explained by various levels of covalent fusion. (g) Expected copy number correlations between pairs of ecDNA species in dividing daughter cells in the indicated cancer cell lines based on quantified levels of covalent fusion (Pearson’s R, two-sided test). (h) Representative images of immunofluorescence-DNA-FISH staining for Aurora kinase B protein marking dividing daughter cells, CIP2A, FGFR and MYC ecDNA, and DNA staining by DAPI in SNU16m1 cells after treatment with CRISPR-Cas9 and a non-targeting control guide RNA or a guide RNA targeting the protein coding sequence of CIP2A (CIP2A KO). Scale bars, 10 µm. (i) Violin plot showing CIP2A levels in the control (n = 86 cells) or CIP2A KO (n = 114 cells) SNU16m1 cells. Box center line, median; box limits, upper and lower quartiles; box whiskers, 1.5× interquartile range. (j) Per-cell ecDNA contents containing the indicated oncogene sequences of daughter cells in the control or CIP2A KO SNU16m1 cells (Pearson’s R; error bands represent 95% confidence intervals). The difference between the two correlations is not statistically significant (Fisher’s z-transformation and one-sided test).

