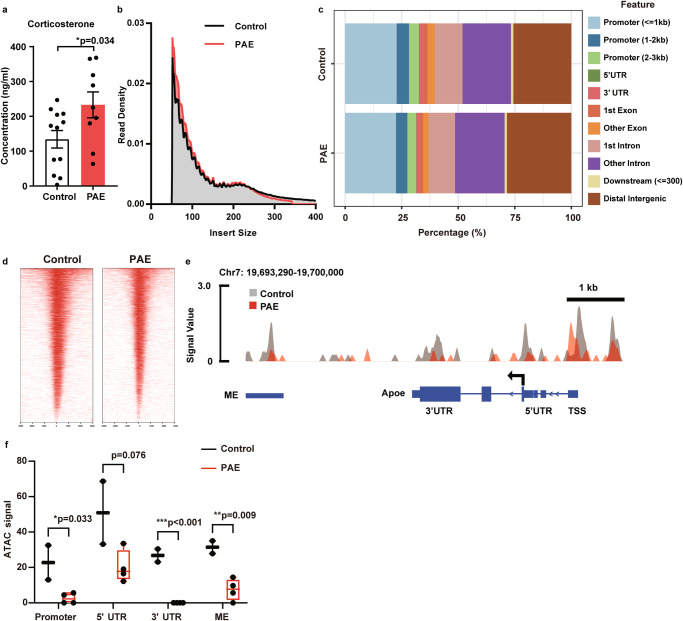
Fig. 4. PAE decreases chromatin accessibility in the brain.
a PAE mice show a significantly increased corticosterone concentration in the plasma compared to control mice (control: n = 12, PAE: n = 9). *P < 0.05 by two-tailed Student’s t-test. Data represent mean ± s.e.m. b Distribution of ATAC-seq fragment lengths shows enrichment under 100 bp and around 200 bp, indicating nucleosome-free and mono-nucleosome-bound fragments, respectively. c Peak annotation graphs show that the proportion of aligned genomic features is similar between control and PAE samples. d Heatmap shows the enrichment of ATAC reads around the transcription start site (TSS) (−1,000- + 1,000) in both control and PAE mouse samples. ATAC-seq signal in regulatory regions of the Apoe (e) and the quantification (f) show significantly reduced chromatin accessibility in the promoter, 3’ untranslated region (UTR), and multienhancer (ME) in the PAE group. 5’ UTR shows a trend of decrease in the PAE group (control: n = 2, PAE: n = 4). *P < 0.05, **P < 0.01,***P < 0.001 by two-tailed Student’s t-test. The box plot represents the 25th, median, and 75th percentile. Whiskers extend to the min and max values. Each dot represents an individual animal.

