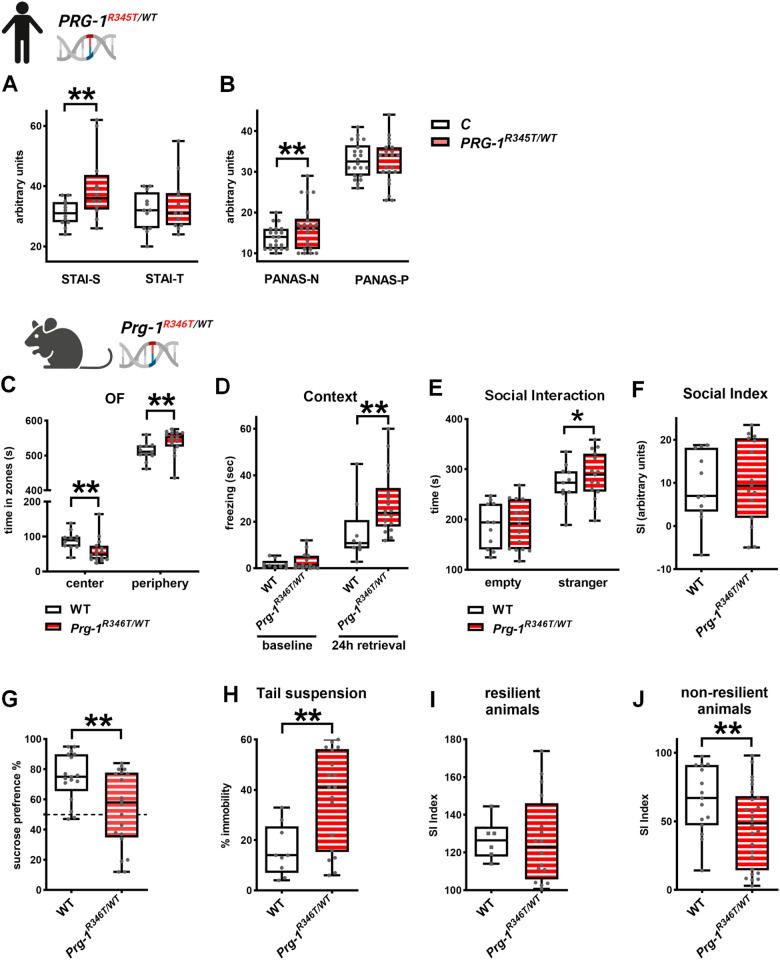
Fig. 2. PRG-1R345T/WT SNP results in a phenotype consisting of mild levels of anxiety, depression and reduced stress coping in humans and mice.
A Human PRG-1R345T/WT carriers displayed higher anxiety levels of state anxiety (STAI-S) but no difference in trait anxiety (STAI-T) when compared to control subjects as assessed by the State-Trait-Anxiety Inventory (STAI) (n = 12 control subjects and 12 PRG-1R345T/WT carriers, Bayesian analysis). B In the positive and negative affect schedule (PANAS), PRG-1R345T/WT carriers displayed higher levels for negative affects (PANAS-N) but no difference for positive affects (PANAS-P) when compared to control matched subjects (n = 21 control subjects and 22 PRG-1R345T/WT carriers for PANAS-N and 22 control subjects and 22 PRG-1R345T/WT carriers for PANAS-P, Bayesian analysis). C Prg-1R346T/WT mice display reduced stay in the center of a novel open field (OF) arena and spent accordingly more time in its periphery when compared to WT litters (n = 11 WT mice, 14 Prg-1R346T/WT mice, Bayesian analysis). D Fear conditioning revealed no significant difference at baseline but higher freezing 24 h after foot shock when animals were returned to the place where they previously received foot shocks (context). (n = 9 WT mice for baseline and after 24 h retrieval and n = 15 Prg-1R346T/WT mice for baseline and 18 Prg-1R346T/WT mice after 24 h retrieval; Bayesian analysis). E, F Social interaction and social interaction (SI) index were preserved in Prg-1R346T/WT expressing mice. (n = 11 WT mice, 15 Prg-1R346T/WT mice, Bayesian analysis). G Sucrose preference was significantly reduced in Prg-1R346T/WT mice when compared to WT litters (n = 17 WT mice and n = 20 Prg-1R346T/WT mice, Bayesian analysis). H Immobility in the tail suspension test (TST) following acute restrain stress was significantly increased in Prg-1R346T/WT mice when compared to WT litters (n = 9 WT mice and n = 18 Prg-1R346T/WT mice, Bayesian analysis). I, J Analysis of mice following chronic social defeat stress revealed no difference in social interaction index between Prg-1R346T/WT mice and their WT litters in the group of resilient animals (defined by an SI index over 100). However, in the group of non-resilient animals (SI index below 100) Prg-1R346T/WT mice displayed significantly reduced SI (n = 15 non-resilient WT mice and 26 non-resilient Prg-1R346T/WT mice; n = 6 resilient WT mice, and 16 resilient Prg-1R346T/WT mice; Bayesian analysis). Data are represented as box plots with whiskers covering all individual data points. Median is shown by solid line. (* and ** show group differences of * >80% or **>90%, Bayesian analysis).

