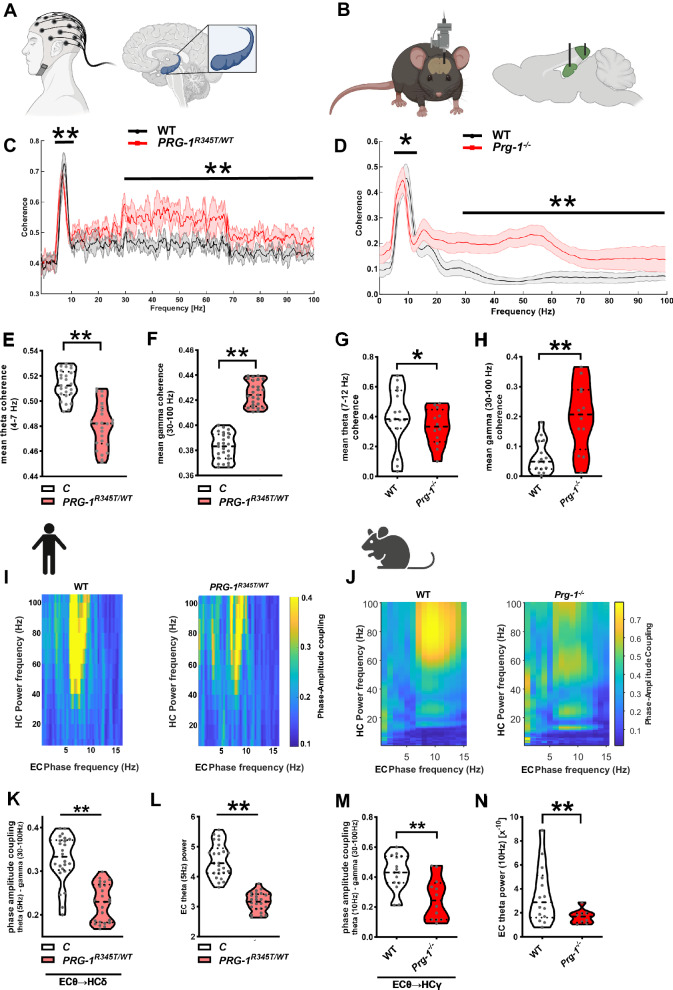
Fig. 3. Analyzes on cortical network synchronization (coherence) revealed similar changes in PRG-1R345T/WT human mutation carriers and in Prg-1−/− mice.
A Exemplary image of EEG coherence analysis in the human entorhinal-hippocampal network. B Exemplary image of invasive mouse in-vivo measures and synchronization analysis of the murine entorhinal cortex (EC) and hippocampus (HC). C PRG-1R345T/WT human carriers revealed significant decrease in the theta range (4–8 Hz) and an increase in the gamma range (30–100 Hz) when compared to control human subjects (n = 25 control subjects, 25 PRG-1R345T/WT carriers, Bayesian analysis). D In-vivo analysis of WT and PRG-1−/− mice revealed significantly decreased theta coherence (7–12 Hz) and increased gamma coherence (30–100 Hz) when compared to WT litters. (n = 15 WT mice, 13 Prg-1−/− mice, Bayesian analysis). E, F Theta coherence (4–8 Hz) between the EC and the HC was reduced in PRG-1R345T/WT human carriers, while gamma coherence (30–100 Hz) was significantly increased (n = 25 control subjects, 25 PRG-1R345T/WT carriers, Bayesian analysis). G, H. Theta coherence (7–12 Hz) in the entorhinal-hippocampal network of Prg-1−/− mice was significantly decreased, while low and high gamma coherence (30–100 Hz) was significantly increased (n = 15 WT mice, 12 Prg-1−/− mice, Bayesian analysis). I Representative phase-amplitude coupling (PAC) plots of EC theta and HC gamma. Left PAC plot shows high PAC levels of EC 5–8 Hz theta oscillation and hippocampal gamma power in the range of 40–100 Hz in a control human subject. Right PAC plots depicts reduced modulation of HC gamma power by EC theta frequency in a PRG-1R345T/WT human mutation carrier. J Representative PAC plot of a wild type animal (left, WT) showing strong modulation of the hippocampal gamma power by entorhinal theta frequencies. Note the phase-amplitude correlation (yellow) showing highest values between 60 and 100 Hz for hippocampal gamma power modulated by 7–12 Hz entorhinal theta frequencies. Right plot displays representative PAC of a Prg-1−/− mouse showing reduced phase-amplitude correlation (yellow). K PAC of entorhinal theta oscillation (5 Hz, EC θ) and hippocampal gamma power (30–100 Hz, HC γ) shows reduced PAC in PRG-1R345T/WT human mutation carriers when compared to matched control subjects (n = 25 control subjects, 25 PRG-1R345T/WT carriers, Bayesian analysis). L EC theta power (5 Hz) was significantly decreased in PRG-1R345T/WT human mutation carriers when compared to control subjects (n = 25 control subjects, 25 PRG-1R345T/WT carriers, Bayesian analysis). M PAC of EC theta oscillation (10 Hz, EC θ) and hippocampal gamma power (30–100 Hz, EC γ) shows reduced coupling in Prg-1−/− mice when compared to their wild type litters (n = 15 wild type mice and 12 Prg-1−/− mice, Bayesian analysis). N EC theta power (10 Hz) was significantly reduced in Prg-1−/− animals (n = 14 WT and 10 Prg-1−/−). E–H, K–N. Data are represented as box plots with whiskers covering all individual data points. Median, lower, and upper quartiles are indicated by dotted line. (* and ** show group differences of * >80% or **>90%, Bayesian analysis).

