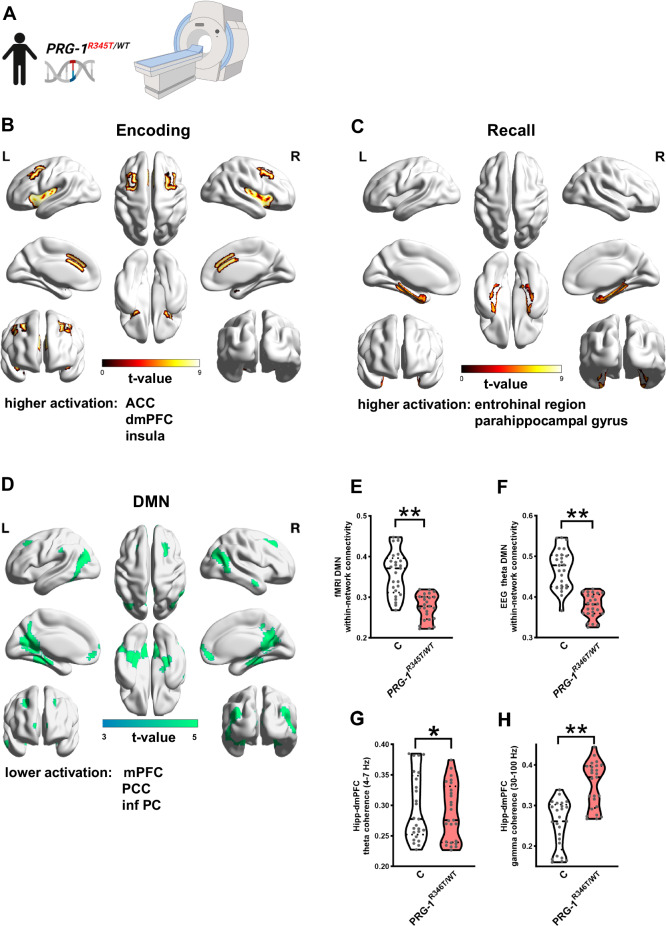
Fig. 5. Functional imaging in PRG-1R345T/WT mutation carriers revealed higher brain activation in an episodic memory paradigm and reduced DMN connectivity.
A Experimental paradigm using fMRI. Human control subjects and PRG-1R345T/WT carriers were subjected to an episodic memory task under fMRI conditions. B Regional brain activation during encoding in an episodic memory test shows higher bilateral activation in the anterior cingulate gyrus (ACC), in the dorsomedial prefrontal cortex (dmPFC) as well as in the insula (In) in PRG-1R345T/WT human mutation carriers when compared to control subjects. C Regional brain activation during recall was significantly higher in PRG-1R345T/WT mutation carriers in both hemispheres in the entorhinal region (EC) and in the parahippocampal gyrus (PHC). t-values for higher activation are represented by color bar in (B, C). D Default mode network (DMN) analysis of fMRI data during episodic memory test revealed lower activation of medial prefrontal cortex (mPFC), posterior cingulate cortex (PCC) and inferior parietal cortex (inf PC) in PRG-1R345T/WT human mutation carriers when compared to matched control subjects. t-values for deactivation are represented by color bar. E fMRI network connectivity analyses within the DMN (within-network connectivity) showed lower connectivity of mPFC, PCC and inf PC. F EEG theta connectivity analyses within the DMN (within-network connectivity) revealed lower connectivity of mPFC, PCC, and inf PC. G, H. Resting state coherence in the prefrontal-hippocampal loop (dorsomedial prefrontal cortex, dmPFC) displayed reduction in the theta range and an increase in gamma range in PRG-1R345T/WT human carriers when compared to matched controls All above mentioned analyses were performed in n = 25 control subjects, 25 PRG-1R345T/WT carriers. Data are represented as violin plots covering all individual data points. Median, lower and upper quartiles are shown by dotted linie (* and ** show group differences of * >80% or **>90% for Bayesian analysis).

