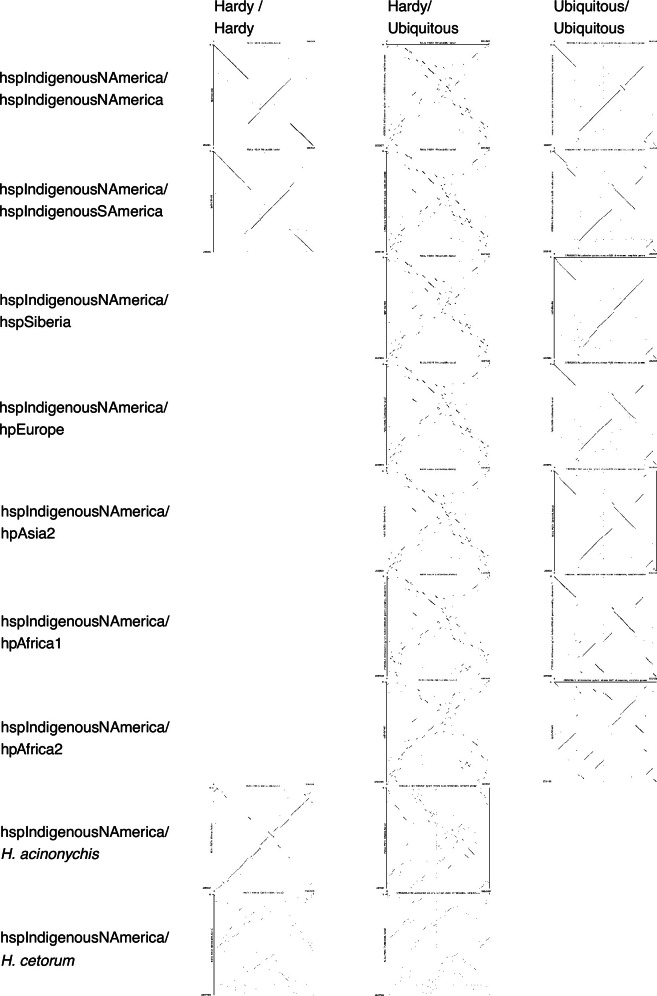
Extended Data Fig. 7. Dot plot comparisons between genomes within and between ecospecies.
The genomes of two hspIndigenousNAmerica, one Hardy and one Ubiquitous strain were plotted against the genome of strains more or less distantly related, from left to right: hspIndigenousNAmerica, hspIndigenousSAmerica, hspSiberia, hpAsia2, hpEurope, hpAfrica1, hpAfrica2, H. acinonychis and H. cetorum; and from top to bottom: Hardy vs Hardy strains, Hardy vs Ubiquitous strains and Ubiquitous vs Ubiquitous strains. Comparison between identical genomes would give single diagonal line, with breaks indicating rearrangements and differences in genome content. The presence of several small lines indicates that there are many rearrangements between the two genomes being compared. On the contrary, comparisons with long lines means highly similar genomes. For more details on how the comparisons were made, see the paragraph “Genome structure comparison” in the Method section.

