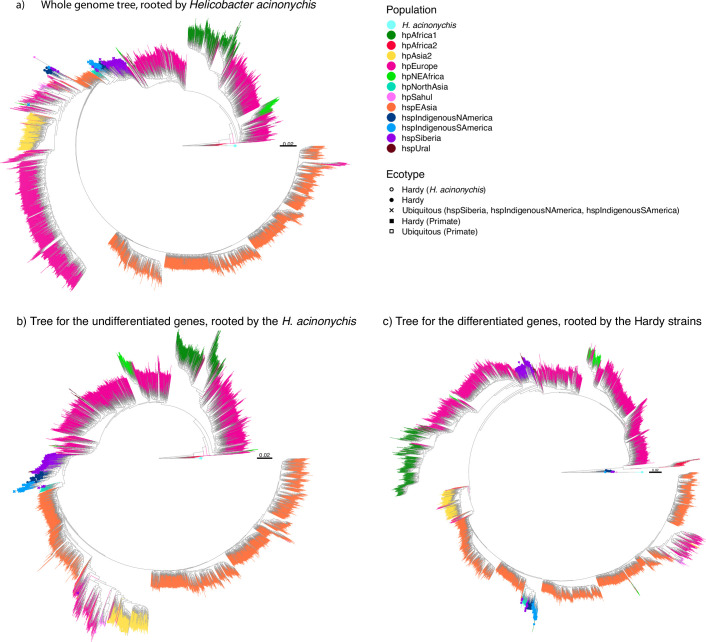
Extended Data Fig. 2. Phylogenetic trees for all strains in the dataset.
The branches are coloured based on their population. Hardy strains are represented with a circle while the other strains from the same populations are represented with a cross. The primate strains are represented with squares. Phylogenetic trees for all the genes (A). Some strains from hspIndigenousNAmerica, hspIndigenousSAmerica and hspSiberia do not cluster with their expected population. For undifferentiated genes (B) and for the differentiated genes (C). The branches are coloured based on the population and the strains from the Hardy clade are indicated with a dot.

