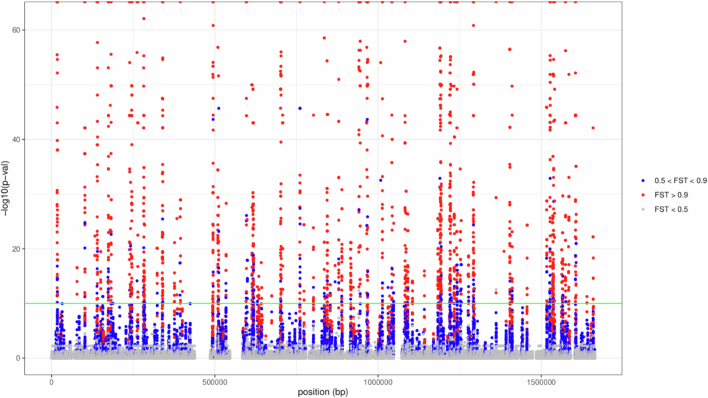
Extended Data Fig. 5. Manhattan plot resulting from a GWAS analysis of the Hardy vs Ubiquitous strains from hspSiberia and hspIndigenousNAmerica.
The green line represents the significance threshold (-log10(p) = 10, bayesian Wald test with a correction for multi-testing giving a significance threshold equals to α/nsnps = 0.05/285,792). Points are coloured based on FST (fixation index between Hardy and Ubiquitous ecospecies) values (red: FST > 0.9, blue: FST 0.5 − 0.9, grey: FST < 0.5). Half points at the top of the plot indicate an estimated p-value of zero and FST of one.

