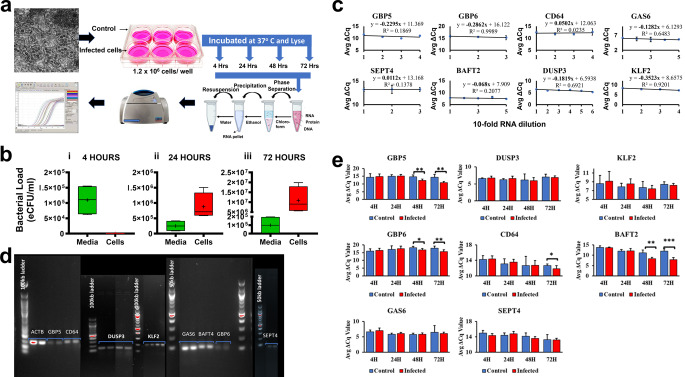
Figure 3.
Assessing primer performance in measuring gene expression in a tissue culture model of infection. a, Illustration of the lung fibroblast infection assay, extraction procedure and PCR amplification cycle. b, BCG association with lung fibroblasts increases with time of incubation. Shown are box plots of bacterial load in eCFU/ml in infected media (green) and in infected lung fibroblast cells (red) after (i) 4 h, (ii) 24 h, and (iii) 72 h of incubation. c, Amplification efficiency of the target and reference primers compared. Line graph showing average ΔCq values between target and reference primers at serial dilutions of mRNA. A slope of close to 0 indicated similar amplification efficiency of the target genes and the reference gene ACTB. d, Agarose gel electrophoresis for amplified targets. e, Upregulated expression of genes in infected human lung fibroblast cells. Bar graphs showing average (Avg.) normalised Cycle quantification (Cq) values as a ratio to Avg. Cq values for the reference gene, ACTB. The lower the Avg. ΔCq value the higher the gene expression. Mann-Whitney test was used to evaluate for statistical differences. Data are reported as mean values from three repeats of each experiment consisting of 2 uninfected and 4 infected wells, * indicates p-value < 0.05, ** indicates a p-value < 0.01 and *** indicates a p-value < 0.001. Error bars are indicative of the standard deviation of the ΔCq values.

