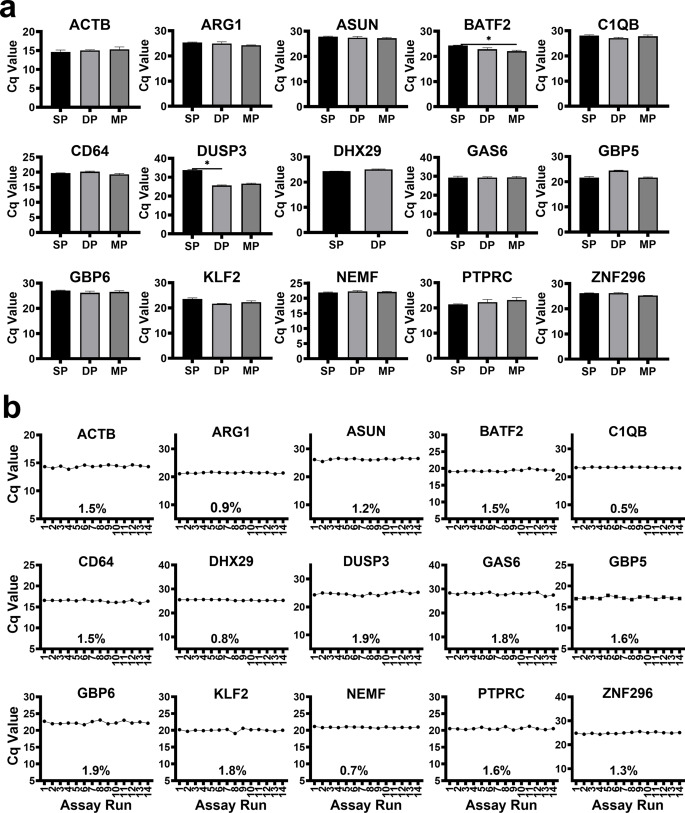
Figure 4.
Assay Optimization. Shown are Cq values measured from an ATB participant sample. a, Assay multiplexing: SP - Single-target reaction, DP - Double-target reaction and MP - Multiplex, mean expression levels. Comparison was performed using the Kruskal-Wallis test and Dunn’s Test with Bonferroni corrected p-values for multiple comparisons. A p-value of 0.05 or less was considered significant and * is equivalent to p < 0.05. b, Assay precision testing line graphs showing assay read-out Cq values. Assay technical repeat runs 1–6 were performed on 4th of November 2022 and assay technical repeat runs 7 to 14 were performed on 6th February 2023. Percentage values within the graph represent the Cq CVs between runs for target genes.

