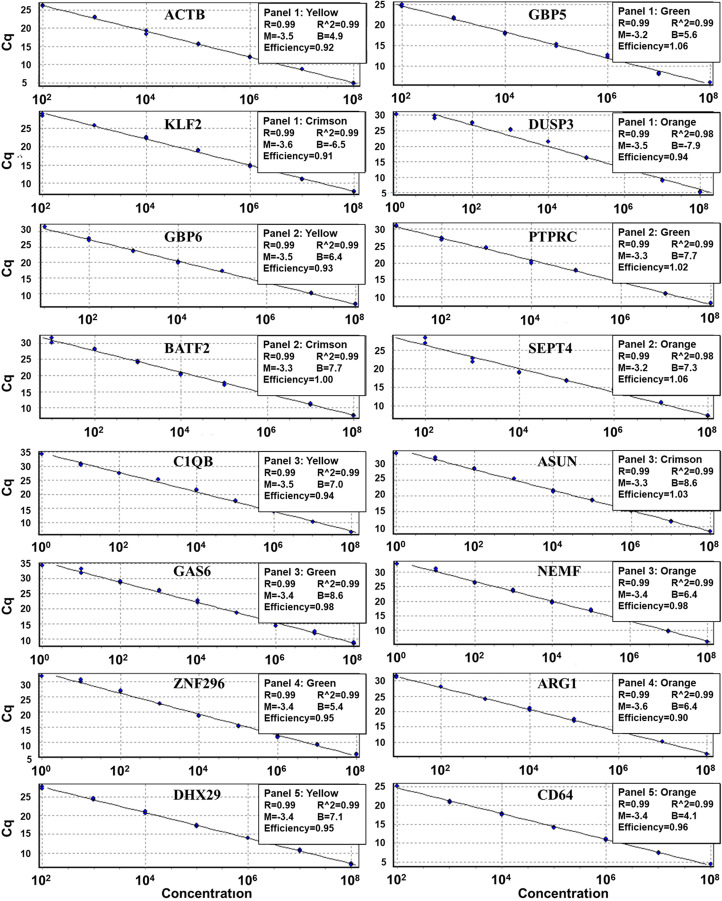
Figure 5.
Assay efficiency assessment. PCR efficiency represented by the best of fit regression line of the standard curve for the HGM targets. Cq – quantification cycles, the x-axis shows the concentration of standard target sequences in copies/µl. Blue dots in the curves represents standard target sequencies quantified at different concentrations. Assay threshold value for all targets was set at 0.01 except GBP6 whose threshold was set at 0.005 because it had low expression in clinical samples. Cycling A - the amplification cycle in the Yellow (HEX), Green (FIM), Crimson (ATTO700) and Orange (ROX) channel. Panel 1/2/3/4/5 are the multiplex reaction panels; Panel 1 to 3 each consisted of 4 HGM and panel 4 and 5 consisted of 2 HGM. R^2 value - coefficient of determination and the R value - Pearson correlation coefficient is the square root of R^2. M and B – represent the slope (M) and the intercept (B) of the standard curve. Efficiency – reaction efficiency by which the independent variable correlates with the dependent variable.

