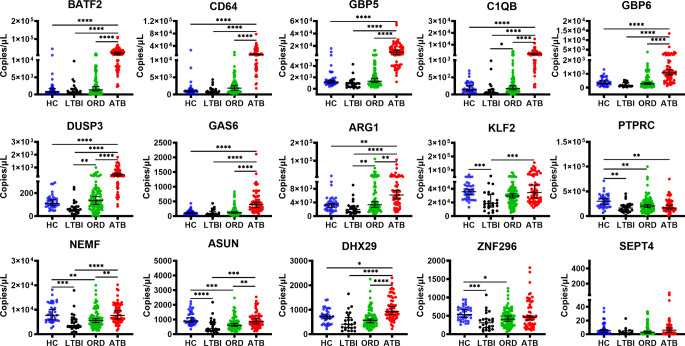
Figure 7.
Host-gene marker expression levels among the study participants. Shown are scatter plots of measured expression levels among the participants namely HC (n = 37), LTBI (n = 24), ORD (n = 82), ATB (n = 61). Lines show the median and 95% confidence intervals. Statistical comparison was performed using the Kruskal-Wallis test and Dunn’s Test with Bonferroni corrected p-values for multiple comparisons. *=<0.05, **=<0.01, ***=<0.001, and ****=<0.0001.

