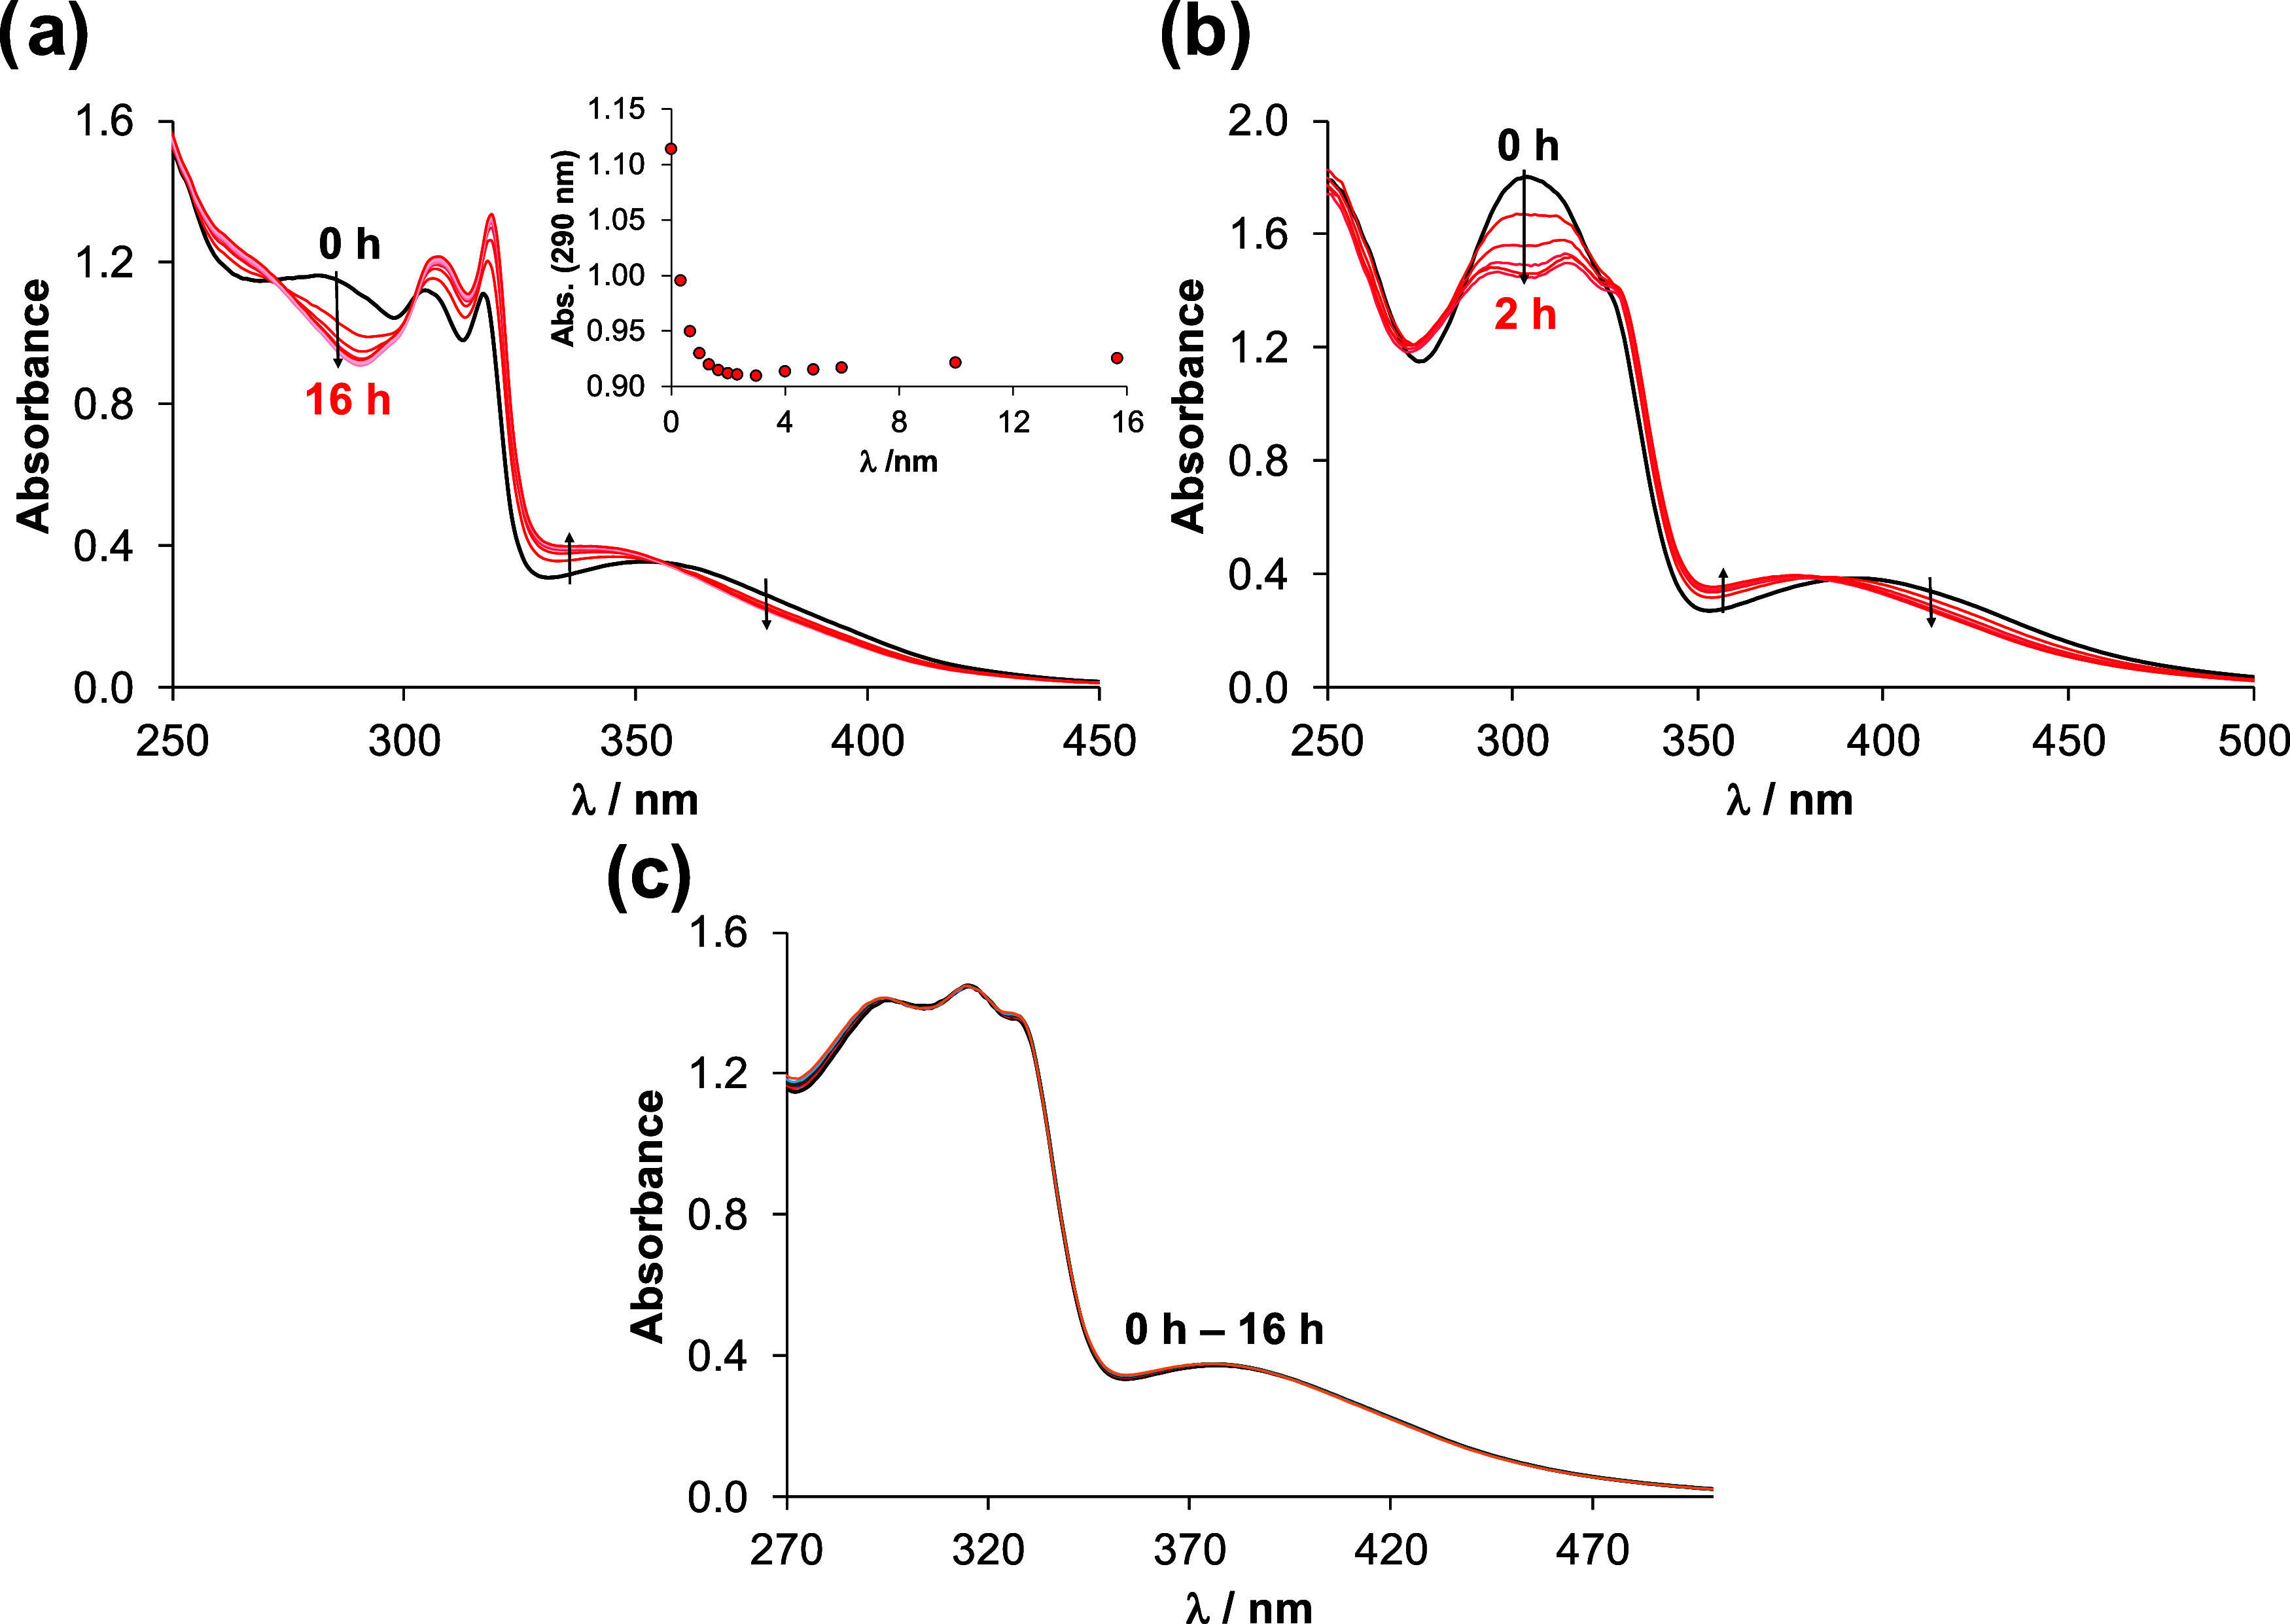
Figure 2.

UV–vis spectra of (a) fac-[Re(CO)3(bpy)(Cl)] chlorido complex, (b) chlorido complex 1Cl and (c) aqua complex 1Aq in 5% (v/v) DMSO/H2O followed over time. Inserted figure in (a) shows absorbance values
at 290 nm (●) plotted against time. {ccomplex = 50 μM; pH ∼ 6.2;  = 1 cm; T = 25.0 °C}.
