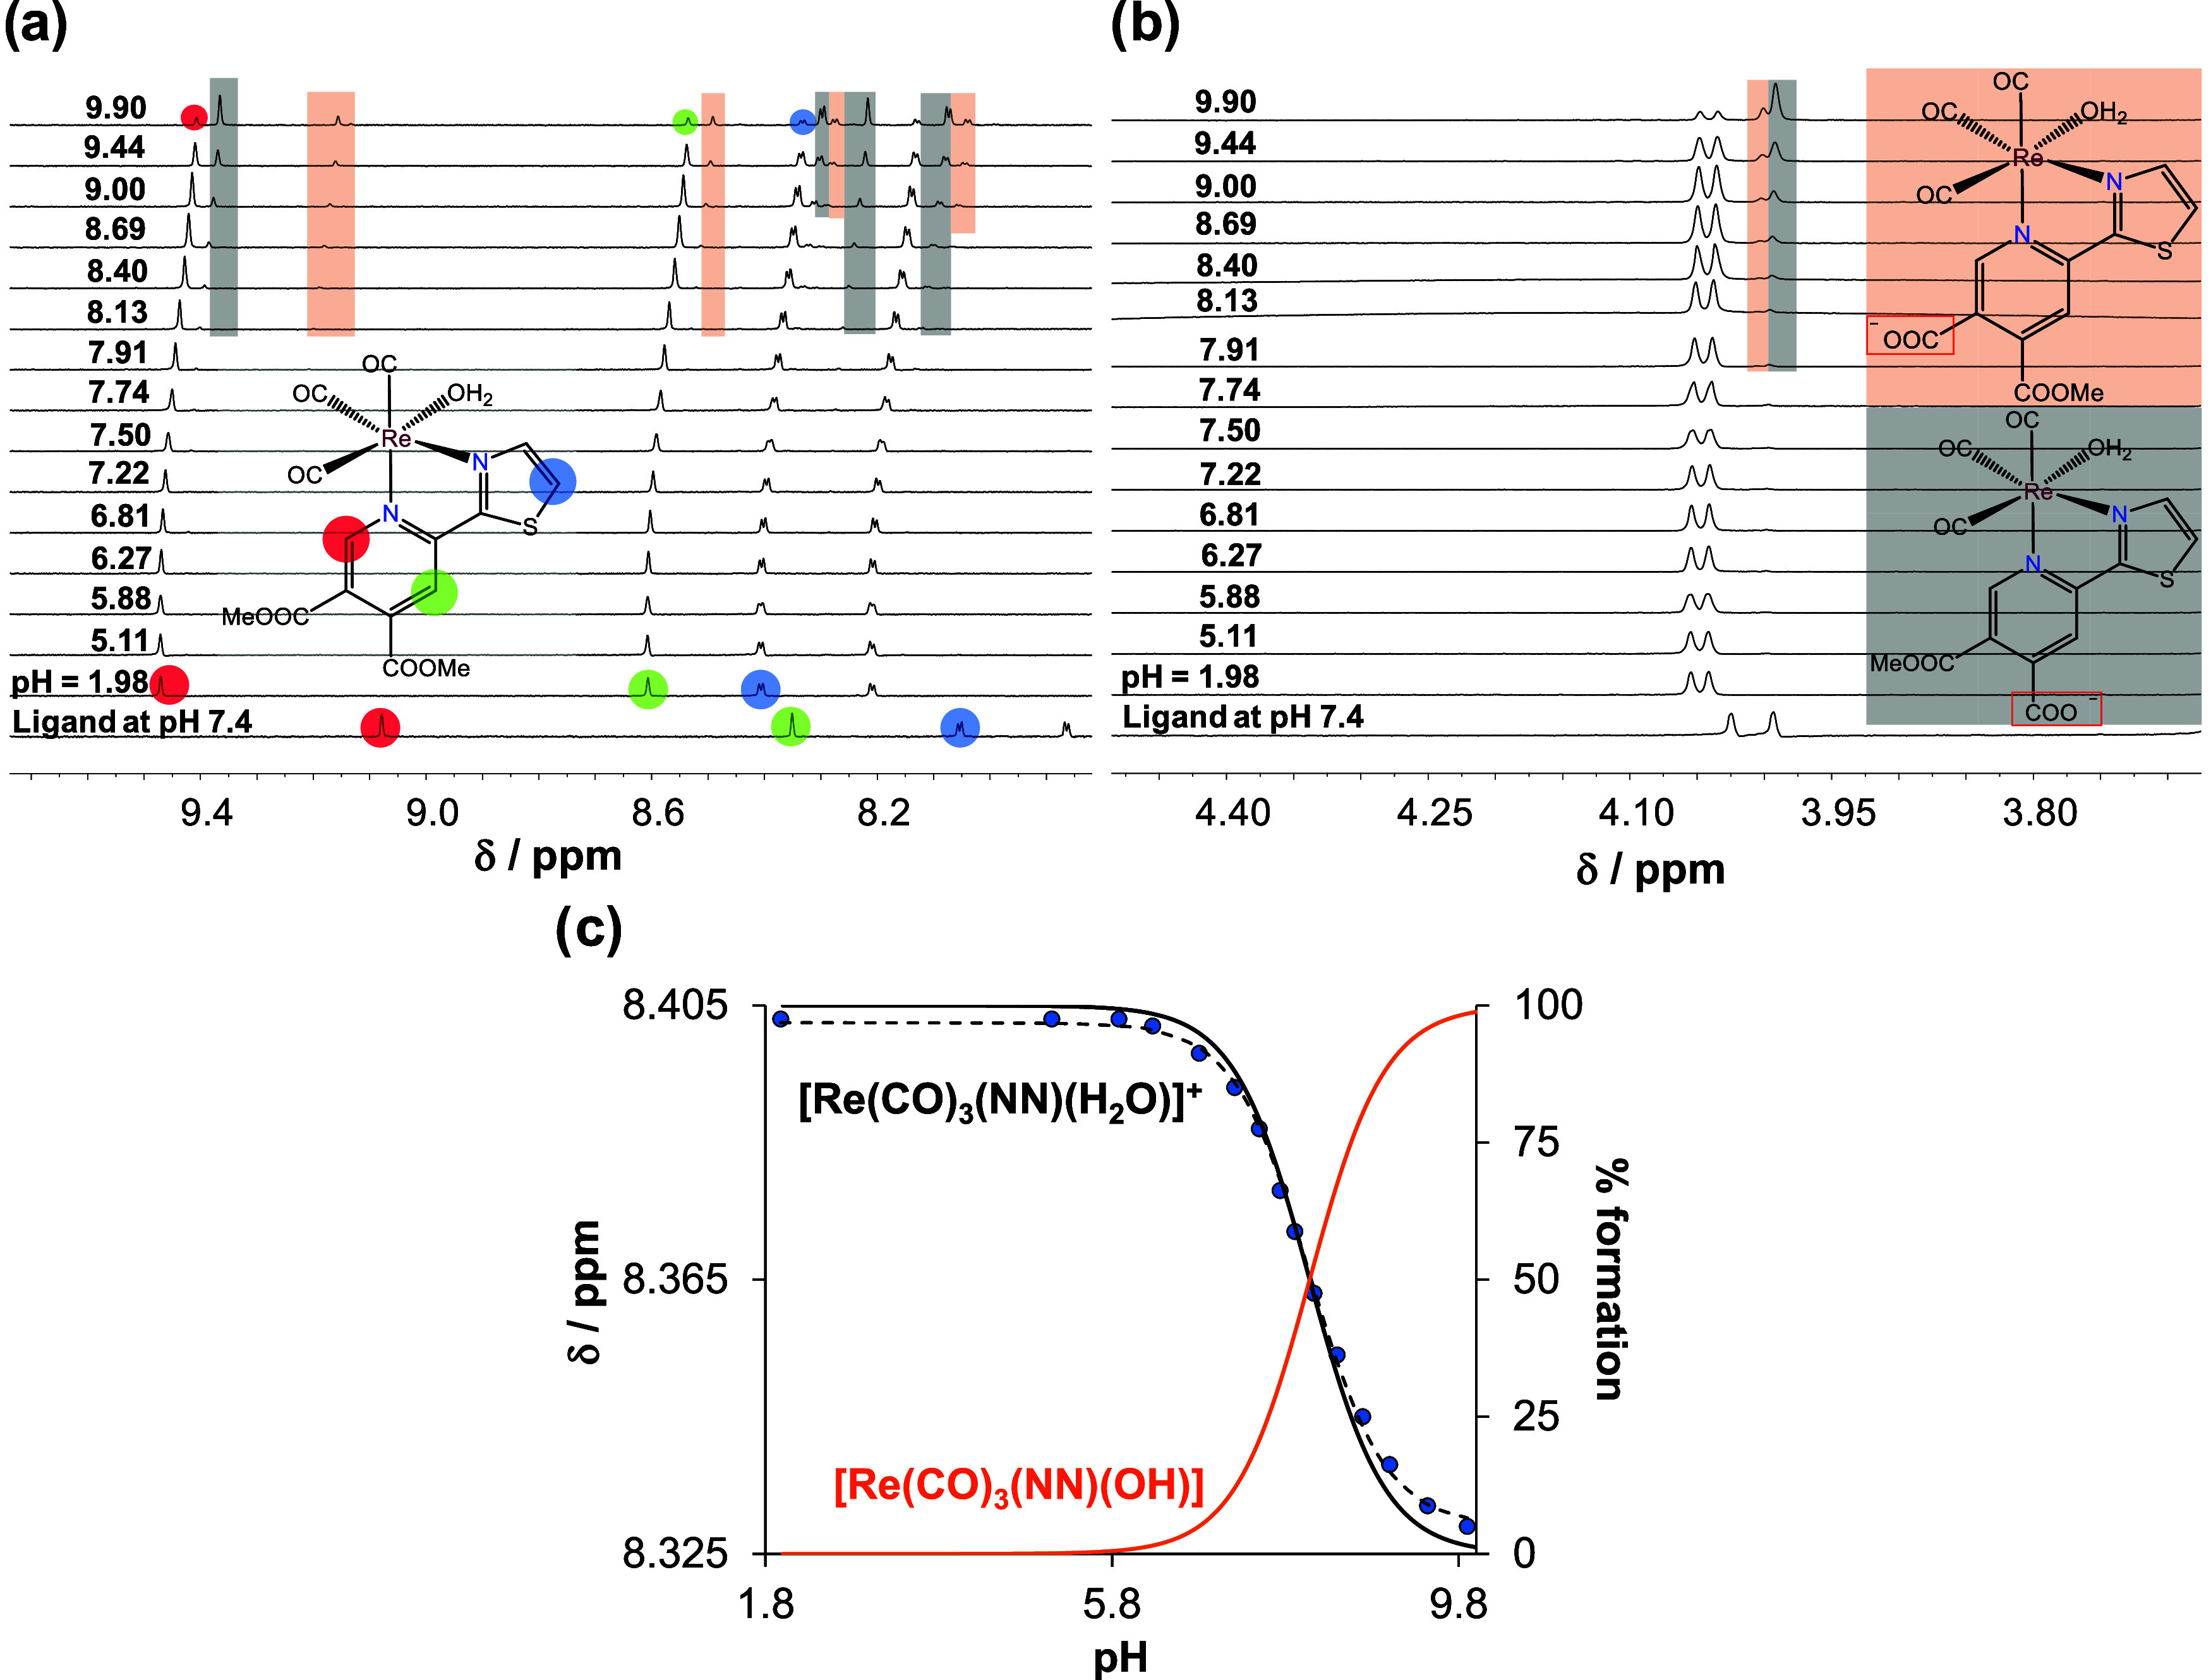
Figure 4.

1H NMR spectra in the (a) low-field and (b) high-field region of 3Aq complex at different pH values (1.98 → 9.90). The spectrum of the free ligand is also shown at pH = 7.4. Rectangles with colored backgrounds indicate the appearance of new sets of peaks related to hydrolyzed products. (c) Chemical shift values of C(5′)H proton (●) along with the fitted line and concentration distribution curves (black and orange solid lines) as a function of pH. It is noteworthy that traces of methanol were present in the solvent, but its peak intensity was increased in the basic pH range (not shown). {ccomplex = 660 μM, I = 0.1 M KNO3, 10% (v/v) D2O/H2O, T = 25.0 °C}.
