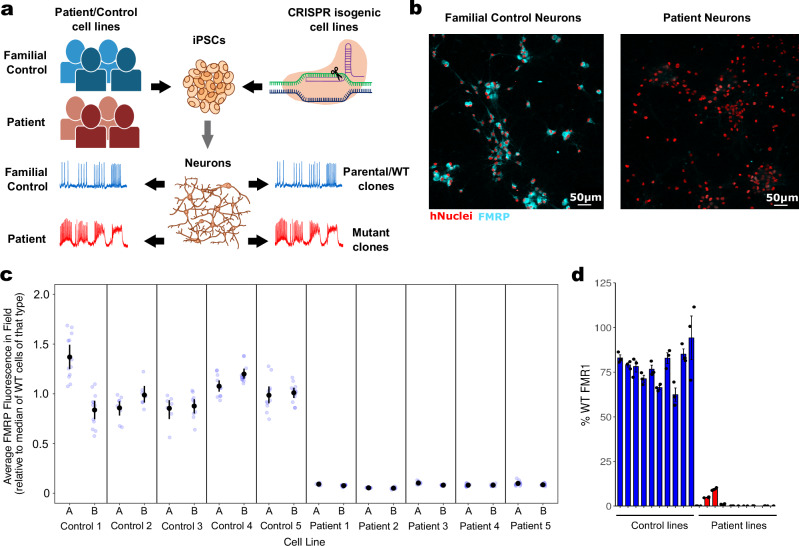
Fig. 1. Production and characterization of control cell lines and disease model cell lines lacking FMRP.
a Graphical representation of neuronal production from patient/control subjects and isogenic iPS cell lines to electrophysiologically-active neurons. b Representative high-content confocal image of control-derived neurons showing FMRP in cytoplasm (cyan) compared to patient-derived neurons that show no FMRP. hNuclei: staining for human-specific nuclear antigen (red). c Quantitative ICC showing levels of FMRP across all 10 control clones (from 5 control donors) and all 10 patient clones (from 5 patient donors). Fluorescence in the proximal cytoplasm was estimated for each cell (identified via nuclei) and aggregated to a field-level average, then rescaled such that the median control field = 1. Mean and 95% confidence intervals are shown in black. d qPCR showing average FMR1 expression in each of the lines. Some of the patient lines expressed breakthrough FMR1. The qICC data for these lines indicated that some individual neurons (about 0.5–3%) expressed FMRP while the rest did not.

