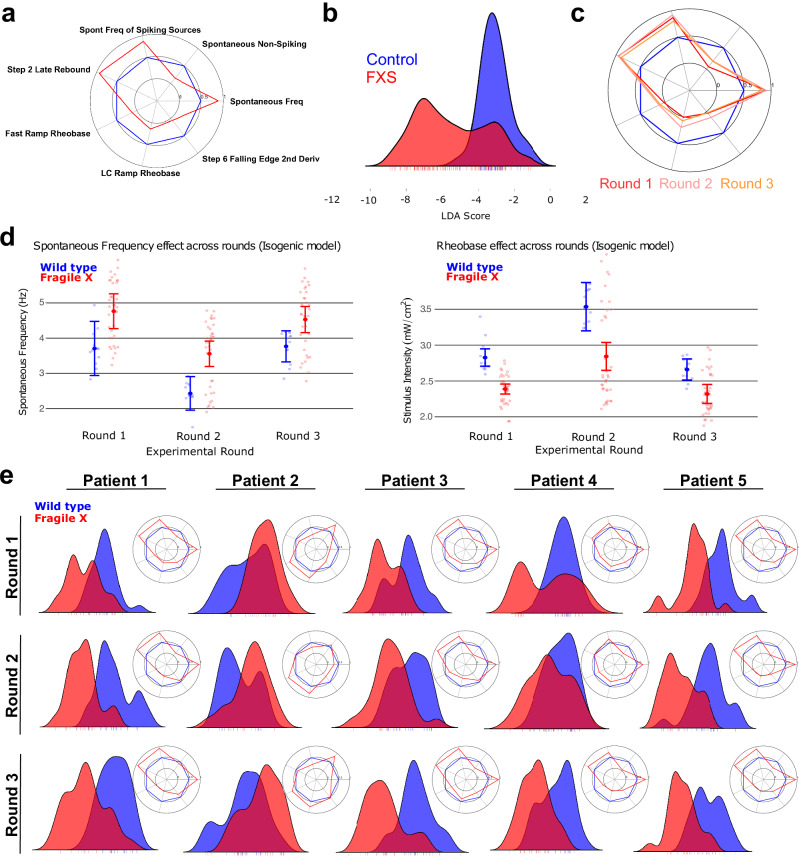
Fig. 2. FMRP-dependent electrophysiological FXS phenotypes in iPSC-derived neurons.
a Machine learning-identified intrinsic excitability FXS fingerprint in the isogenic reagents expressed as a radar plot of control (blue) vs. FXS (red). Values reflect the “common language effect size”, a parametric estimate of the probability that a random FXS well exceeds the value of a random CTRL well (where probability = 0.5 is a null effect). b LDA score for control (blue) vs. FXS (red) in the isogenic reagents, see methods for detail. Three FXS clones are represented – two show a distinct phenotype while the third (the peak inside the CTRL distribution) does not. c Radar plots showing the phenotype in isogenic reagents across 3 replicate rounds show consistency across fresh-from-thaw platings of neurons. d Difference in spontaneous frequency (left) and rheobase (right) of control (blue) vs. FXS (red) for each of three rounds. Error bars represent 95% confidence intervals around the well-level estimates. e LDA scores for family-matched controls vs. patient neurons from 5 different patient/control cell lines (labeled Pair 1 to Pair 5). Each Pair includes the average of 2 control clones and 2 patient clones. Radar plots for the FXS fingerprints are depicted in the inset. Data for 3 rounds is shown.

