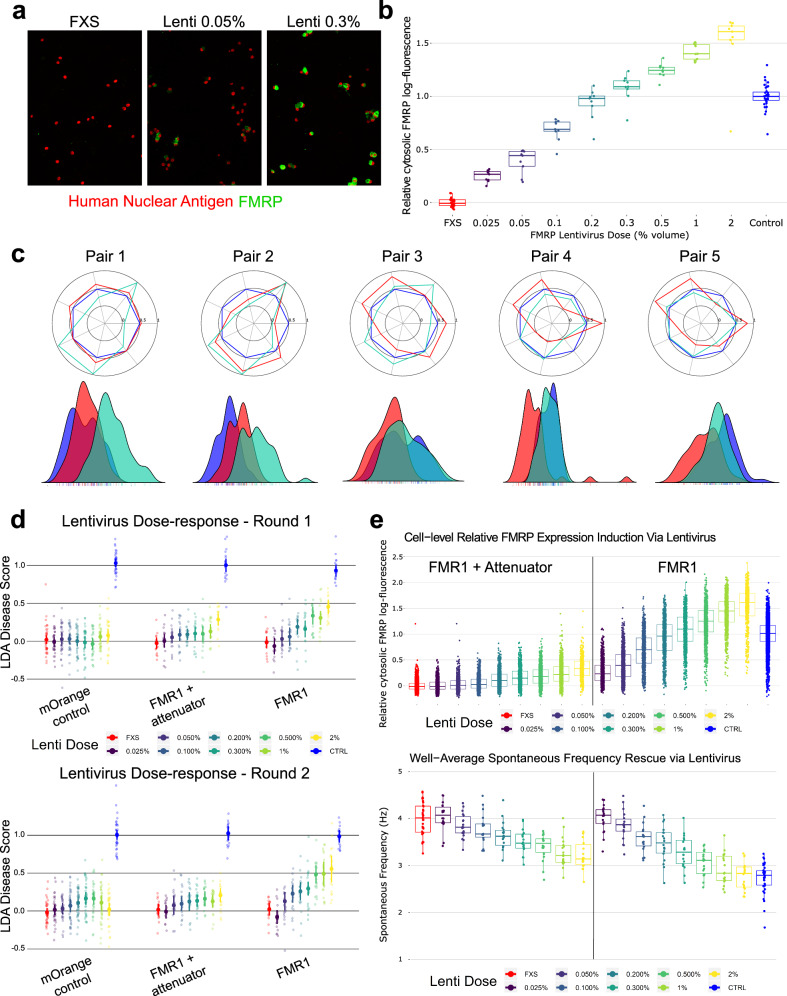
Fig. 3. Use of FMR1 lentiviruses to establish FMRP levels needed to rescue FXS phenotypes.
a Representative high-content confocal images showing dose-sensitive restoration of FMRP expression in FXS neurons. At low doses (e.g., 0.05% volume), only some neurons express FMRP after transduction. At higher doses, nearly every neuron expresses FMRP, but increased lentivirus doses increase average per-cell expression. b Quantitative ICC showing amount of FMRP introduced via the lentivirus across a range of doses. Fluorescence in the proximal cytoplasm was estimated for each cell (identified via nuclei) and aggregated to a field-level average, then log-transformed and rescaled such that the on-plate control group = 1, after which data from all plates were combined. c Radar plots showing the FXS phenotype (red) vs CTRL wells (blue) alongside FXS + lentivirus at a single 1% by-volume dose (teal) for each of the five patient-control pairs (both clones for each donor). Values reflect the common language effect size. Beneath is the LDA scores for each group, fit over the isogenic phenotype and applied to each patient-control pair. d LDA score for isogenic FMR1−/y neurons treated with 8 increasing doses (represented as % volume of lentivirus) of either an mOrange fluorescent tag, an attenuated form of FMR1, or a full-strength FMR1, for each of two replicate rounds (round 1 top, round 2 bottom) plated fresh-from-thaw. For each lentivirus condition, lentivirus treated neurons were compared to undosed FXS and CTRL neurons from the same row on the 96-well plate. e Top: Quantitative ICC of FMRP fluorescence of control neurons (blue) and FXS neurons (red) treated with 8 increasing doses (represented as % volume of lentivirus) of either an FMR1 lentivirus (right) or attenuated FMR1 lentivirus (left). Each dot is a neuron. Fluorescence in the proximal cytoplasm was estimated for each cell (identified via nuclei) and aggregated to a field-level average, then log-transformed and rescaled such that the on-plate control group = 1, after which data from all plates were combined. Bottom: Rescue of Spontaneous Frequency phenotype in optical electrophysiology analysis from the same round of data, with the same conditions. Each dot is a well (to better see the change in a subtle phenotype).

