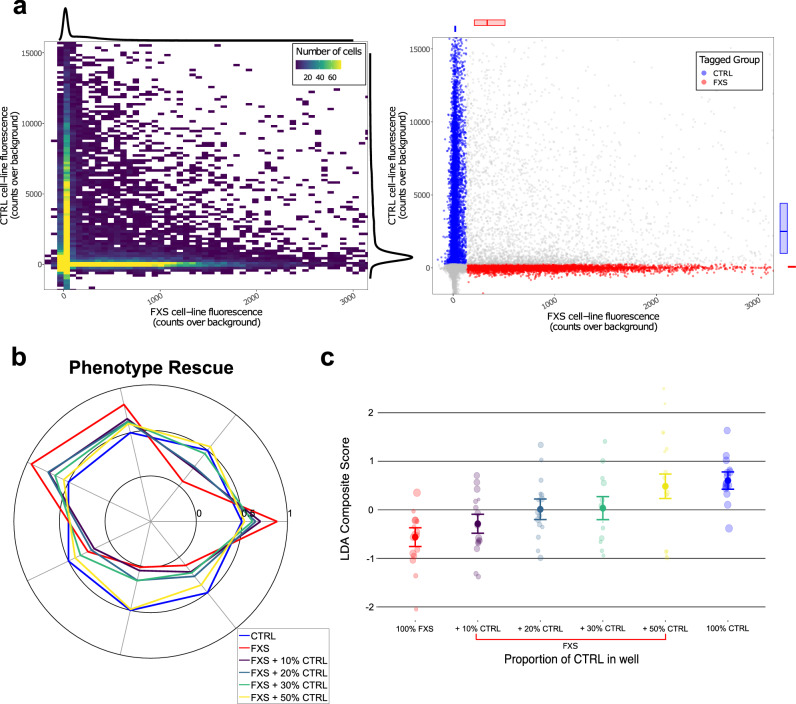
Fig. 4. Modulation of electrophysiological FXS phenotypes via mosaic co-cultures.
a Left: 2D histogram showing the number of cells fluorescing in each of the tag channels (where the orthogonal expression is apparent in the vertical and horizontal ridges) with colors aliased at a max of 75 cells per bin to prevent washout by the high-density peak of non-fluorescers, with 1D kernel density estimates over cells for each channel along the margins. Right: every individual cell in the same data set, color-coded to indicate the assigned tag label, with FXS labels in red and CTRL labels in blue, and ambiguous or non-fluorescing cells in gray. b Radar plot showing the dose-dependent rescue of the phenotype in isogenic reagents via increasing proportions of CTRL neurons in well. Values reflect the common language effect size. Only FXS neurons are reflected in the data from the co-cultured wells (meaning that these data show rescue specifically in cells that do not express FMRP, rather than simply of the overall network which includes CTRL neurons). Neurons are under synaptic blockade at the time of imaging but spent the prior >29 days in vitro without synaptic blockers. c LDA score for 100% control (blue) vs. 100% FMR1−/y (red) and increasing amounts of WT neurons in the network (purple, dark green, light green, yellow). Error bars indicate standard error. Points are well-averages. Point size reflects sample weight (square root of number of quality FXS neurons identified via fluorescent tag in that well). Only FXS neurons are reflected in the data from the co-cultured wells.

