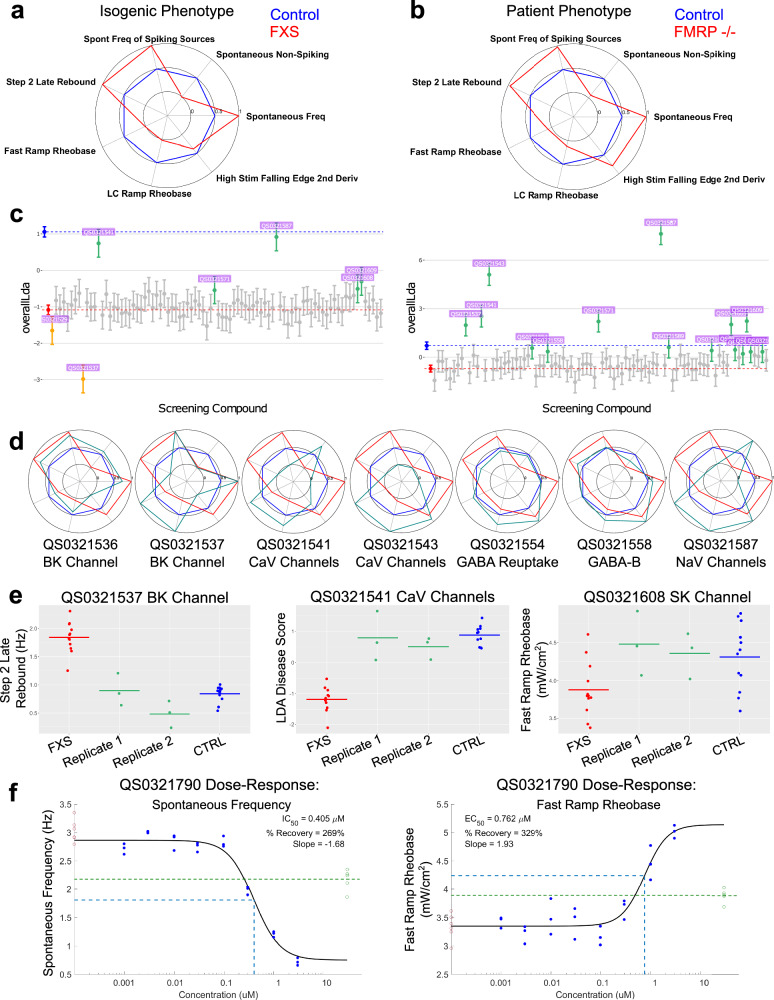
Fig. 5. Small molecule screen identifies multiple hits and targets for therapeutic development.
a Recapitulation of the FXS electrophysiological fingerprint in isogenic neurons measured in a sentinel plate on the day of screening. Values on the radar plot reflect the common language effect size. b Recapitulation of the FXS electrophysiological fingerprint in patient/control neurons measured in a sentinel plate on the day of screening. Values on the radar plot reflect the common language effect size. c The LDA score for on-plate control (blue), on-plate FXS (red), and FXS neurons treated with 86 unique small molecule compounds for the isogenic reagents (left) and a representative patient/control pair (right). All hits identified as green on the graph. Anti-hits marked in yellow-orange. Bars are 95% confidence intervals. d Radar plots for 7 example small molecule compound hits represented as green on each radar plot compared to the control (blue) vs. FMR1−/y (red) FXS fingerprint. For each example hit, the compound ID and molecular target are listed. e Rebound spike rate (left), LDA score (middle) and rheobase (right) for different example compound hits plotted per well and separated by replicate plates. f Dose-response graphs for spontaneous frequency (left) and rheobase (right) for an example compound on the isogenic cell lines. On-plate controls shown in red (FXS, left) and green (CTRL, right), with the dose and the response of the EC50/IC50 marked with dotted blue line. Dotted green line is the mean of the controls.

