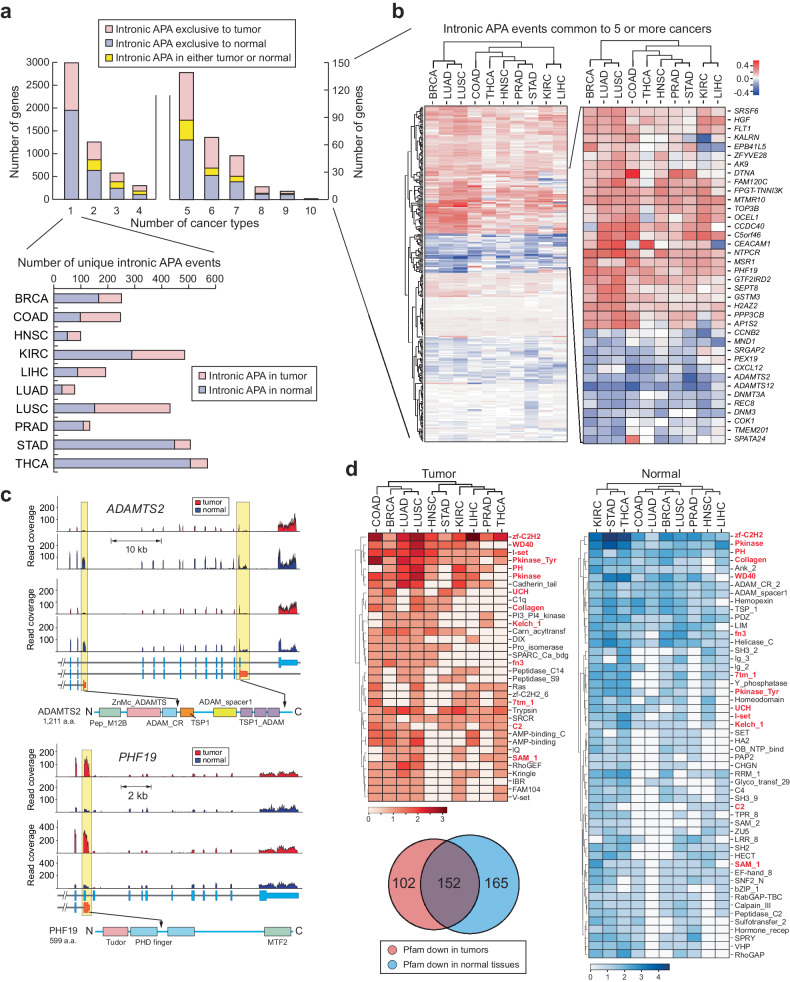
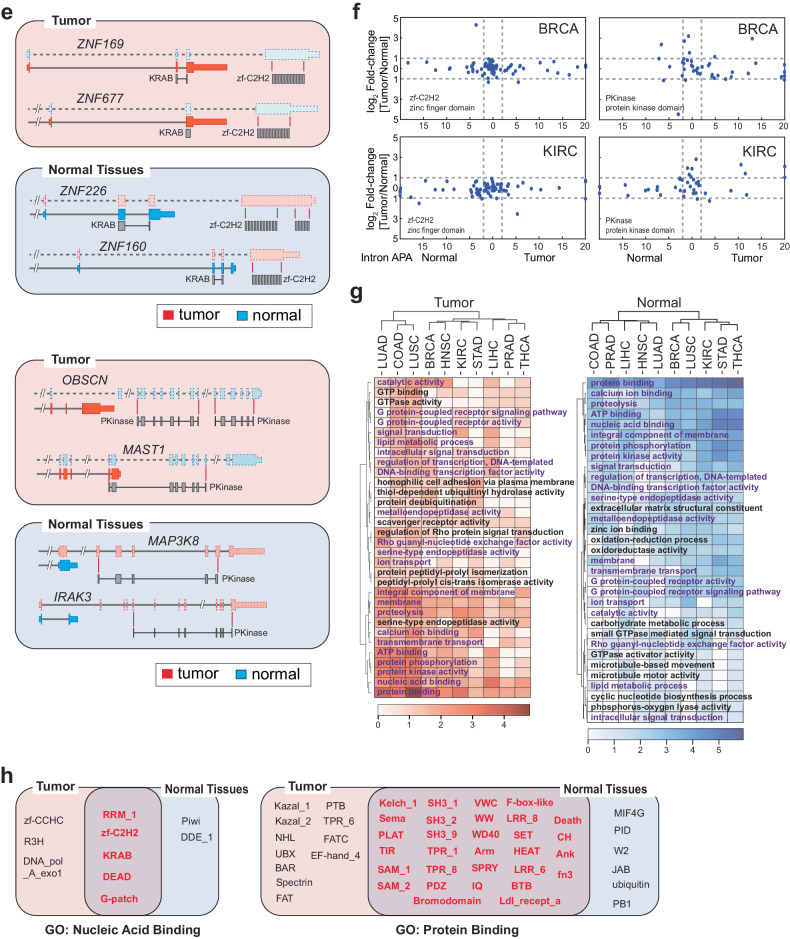
Fig. 3. Intronic APA events in pan-cancer data and their associated molecular characteristics.
a Frequency profile of intronic APA events in TCGA data. The number of intronic APA events is displayed by the occurrence in each cancer. b Heatmap of collective genes displaying a significant intronic APA event enriched in either tumor or normal samples across five or more cancer types. The color scale represents the differences in the mean TR between tumor and normal tissues. Select genes are highlighted in a zoomed-in heatmap as an example. Red and blue represent significant intronic APA events in tumors and normal tissues, respectively. c Two examples of intronic APA events from BRCA TCGA data. RNA-seq read alignments of two matched tumor and normal pairs are shown along with a schematic of the registered Pfam domains. Yellow boxes highlight the locations of intronic APA events. d Registered Pfam domains lost in tumors or normal tissues due to enrichment of intronic APA events. A Venn diagram showing the overall distribution of Pfam domains affected by intronic APA in the pan-cancer dataset. The heatmaps show the list of representative Pfam domains lost in tumors (red) or normal tissues (blue). The Pfam domains in the red text represent overlapping domains between tumors and normal tissues. The scale of the heatmap was calculated as follows: log2[# of APA events + 1]. Significant intronic APA events with domain changes in the exclusive exons of the full-length transcripts were considered. e Schematic representation of Pfam domain swapping in tumors and normal tissues by intronic APA events. Zinc finger domain (zf-C2H2) proteins and serine/threonine protein kinase (PKinase) proteins are shown as examples. f Differential gene expression for genes showing zf-C2H2 and PKinase domain swapping in BRCA and KIRC. The x-axis presents the significance of intronic APA events calculated as −log10(p value). g Heatmap of pan-cancer GO terms enriched in Pfam domains lost in normal tissues and tumor samples. The scale of the heatmap was calculated as log2[# of APA events + 1]. The GO terms common to both normal tissues and tumor samples are highlighted in violet font. h A representation of common and exclusive Pfam domains in cancer and normal tissues. Pfam domains associated with nucleic acid binding and protein binding are shown.


