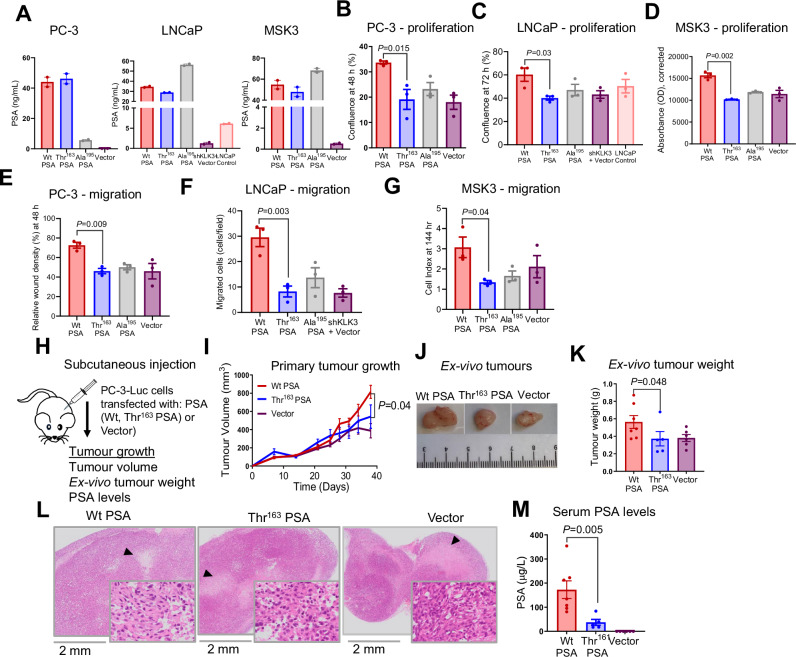
Fig. 1. Thr163 PSA abolishes the effect of PSA on PC-3, LNCaP and patient-derived organoid MSK3 cell proliferation and migration and is associated with reduced growth of primary tumours in-vivo.
PC-3, LNCaP and patient-derived organoid MSK3 cells were transfected with furin-activable Wt PSA, Thr163 PSA, Ala195 PSA or control plasmid (vector). A Expression of PSA from engineered PSA constructs quantified by immunoassay (n = 2 independent experiments). B, C Proliferation rate (confluence %) measured in the IncuCyte live cell imaging system for PC-3 and LNCaP cells expressing PSA variants and vector control at 72 h (n = 3 independent experiments). D Proliferation of MSK3-PSA and vector control cells, measured by PrestoBlue cell viability assay at 144 h (n = 3 independent experiments). E Cell migration rate (relative wound density %) measured by the IncuCyte live cell imaging system for PC-3 cells expressing PSA variants compared to vector control at 48 h (n = 3 independent experiments). F Cell migration of PSA variants expressing LNCaP cells loaded in Boyden chambers at 48 h (n = 3 independent experiments). G Cell migration measured using the xCELLigence system for the PSA variant expressing MSK3 cells as compared to vector control (n = 3 independent experiments). H Preclinical subcutaneous xenograft tumour model of PC-3-Luc cells transfected with furin-activable Wt PSA, Thr163 PSA or vector. I Mean volume of subcutaneous tumours throughout the experiment, based on caliper measurements (Wt: n = 7 mice, Thr163: n = 5 mice, Vec: n = 6 mice). J Representative photographs of resected subcutaneous tumours. K Scatter plot of post-mortem weight of subcutaneous tumours at day 38; horizontal line indicates mean value (Wt: n = 7 mice, Thr163: n = 5 mice, Vec: n = 6 mice). L H&E staining of resected subcutaneous tumours. M Serum concentration of total PSA at endpoint. All error bars represent mean ± SEM. Statistical analyses were determined by one-way ANOVA (B-G, I) or or two-sided Student’s t test (K, M). Source data are provided as a Source Data file.

