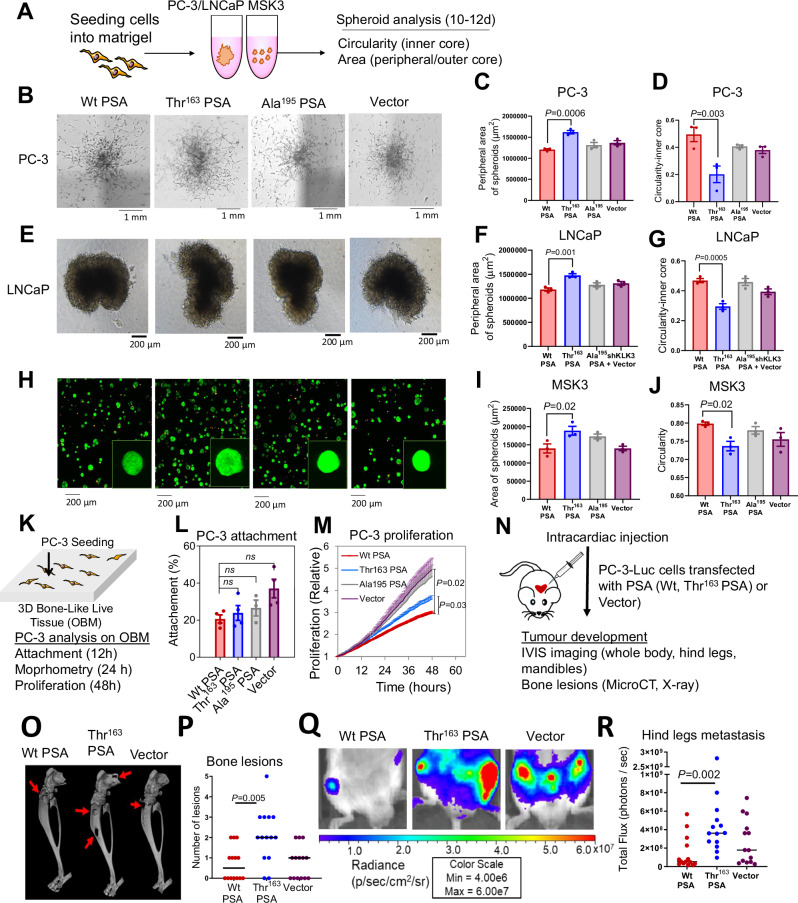
Fig. 2. Thr163 PSA increases cancer cell invasive ability and increases metastasis in-vivo.
A Schematic workflow of spheroid assay. B Representative brightfield microscope images (4× magnification) of 3D spheroids formed by transfected PC-3 cells after 10 days of culture. C Peripheral area (µm)2 of invading cells outside the outer core. Also see Supplementary Fig. 2A. D Measure of invasiveness of the spheroid from 0 to 1 (1 = circular, least invasive; <1 = less circular spheroids). E Representative brightfield microscope images (4×) of LNCaP spheroids after 10 days of culture, F Peripheral area (µm)2 and G circularity. H Representative fluorescent microscopy overlay images (10×) of transfected MSK3 cells at 10 days with a magnified view, stained with calcein-AM (live cells, green) and ethidium heterodimer (dead cells, orange) and spheroid, I Area (µm)2 and J circularity (n = 3 independent experiments for (B–J)). Also see Supplementary Fig. 2B, C. K Schematic of a 3D osteoblast-derived bone matrix (OBM) co-culture with PC-3 cells. L Attachment of PC-3-mKO2-PSA cells to OBM constructs after 12 h co-culture. M PC-3 proliferation on OBM constructs. Also see Supplementary Fig. 3A, B. For (L, M), n = 3 OBM groups from independent patient cells were made and included 2 technical replicates, 4–5 fields of view/replicate, for a total of 120–230 cells per condition. N Intracardiac injection of PC-3-Luc-PSA cells in mice (n = 7 mice/group). O Reconstructed 3D microCT images of tumour-bearing hind legs from representative mice of each group; red arrows showing areas of significant bone degradation, indicating presence of tumour. P Quantification of bone lesions per hind leg based on visual inspection of planar X-ray images; horizontal line indicates median value (n = 14 derived from two hind legs of 7 mice). Q Representative bioluminescence images of tumour-bearing hind legs of mice (week 4). R Scatter plots of tumour bioluminescence based on region of interest (ROI) drawn over individual hind legs (at week 4); horizontal line indicates median value (n = 14). Also see Supplementary Fig. 4. All error bars represent mean ± SEM; one-way ANOVA followed by Dunnett’s multiple comparisons test (C, D, F, G, I, J), Dunn’s multiple comparison test (L, P, R) or Games-Howell post hoc analysis (M). Source data are provided as a Source Data file.

