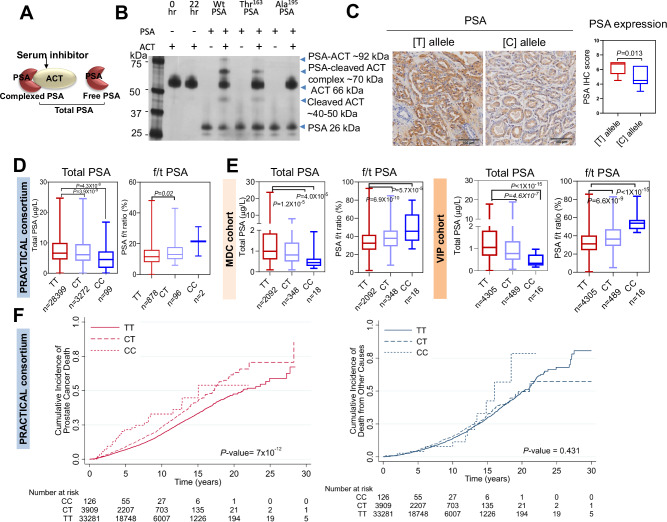
Fig. 4. rs17632442 SNP association with PSA levels and prostate cancer survival.
A PSA-inhibitor (ACT) complex, free and total PSA. B A representative silver stain analysis of recombinant wild type (Wt) and Thr163 and Ala195 PSA (0.1 µM) incubated with ACT (0.5 µM) at room temperature for 3 h before resolving on gel showed lower complexing potential of Thr163 PSA with ACT compared to the Wt PSA. Inactive mutant Ala195 does not complex with ACT (n = 3 independent experiments). C Representative immunohistochemical results for Gleason Grade 4 adenocarcinoma tissues, showing strong staining for PSA for the TT compared to the CC genotype. Graph on the right shows difference in PSA expression scores between [T] and [C] allele (CC: n = 2, CT: n = 10, TT: n = 10) for the immunohistochemical samples. The box plot centre line represents median, the boundaries represent interquartile range (IQR) and min and max are shown. D, E Genotype correlation of total PSA (tPSA) levels and f/t PSA ratio in prostate cancer cases (PRACTICAL consortium) and disease-free controls (MDC and VIP cohorts). D PRACTICAL consortium. n = 31,770; genotype status TT = 28,399, CT = 3272 and CC = 99 for tPSA levels comparison. n = 976; genotype status TT = 878, CT = 96 and CC = 2 for f/t PSA ratio comparison. E MDC cohort with genotype status TT = 2092, CT = 348 and CC = 18; and VIP cohort with genotype status TT = 4305, CT = 489 and CC = 16. For box plots (D, E), median, inter-quartile range (IQR), min and max are shown. F Survival analysis for the rs17632542 SNP (c.536 T > C) in 37,316 cases of PRACTICAL consortium with follow-up on cause specific death. Of these, 4629 died of prostate cancer, 3,456 died of other causes. Cases by carrier status, TT = 33,281, CT = 3909 and CC = 126. The cumulative incidence of death from prostate cancer, Hazards ratio (HR) = 1.33, 95% CI = 1.24–1.45, P < 0.001 (left panel) and all causes other than prostate cancer, HR = 1.08, 95% CI = 0.98–1.19, P = 0.431 (right panel) are indicated. Number at risk are also indicated. All error bars represent mean ± SEM. Statistical analyses were determined by two-sided Student’s t test (C) or one-way ANOVA followed by Dunn’s multiple comparison test (D, E). Source data are provided as a Source Data file.

