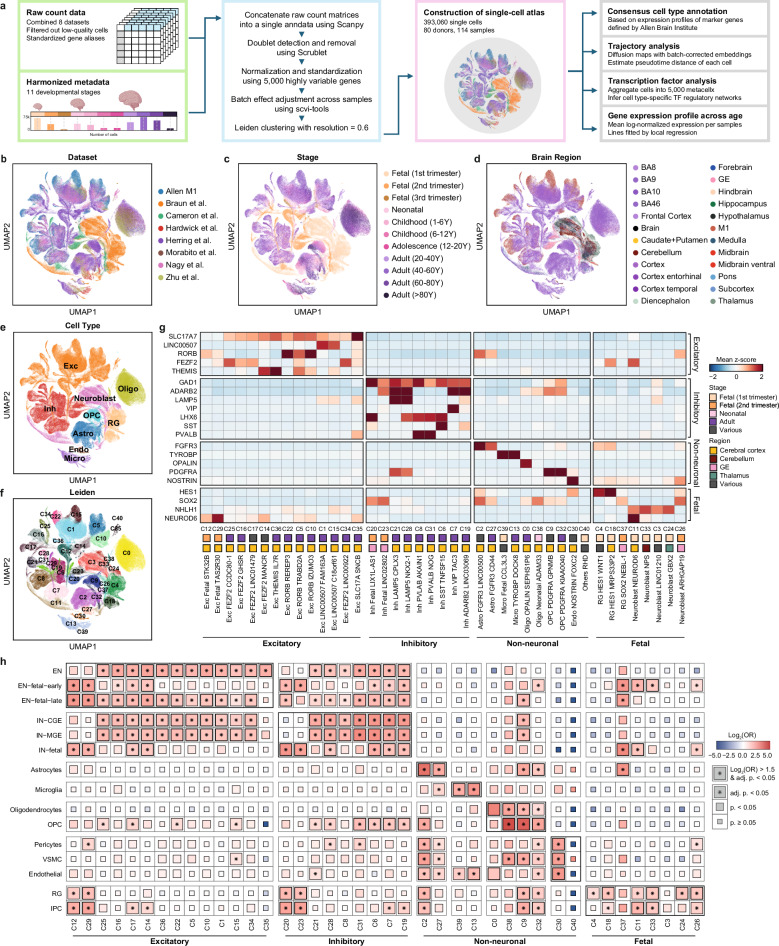
Fig. 1. Integrated single-cell atlas of the developing human brain.
a Schematic of atlas construction and downstream analysis. Uniform manifold approximation and projection (UMAP) of the atlas, colored by (b) integrated datasets, (c) developmental stages, (d) brain regions described in original studies, (e) major cell types, and (f) Leiden clusters. g Taxonomy of 41 Leiden clusters based on the scaled expression of marker genes. The stages and regions with the highest proportions of cells (>35%) were designated. h Gene set enrichment test for the established cell type marker genes sourced from a previous single-cell transcriptome study23. A one-sided Fisher’s exact test was used to compute statistics with multiple comparisons by Bonferroni correction.

