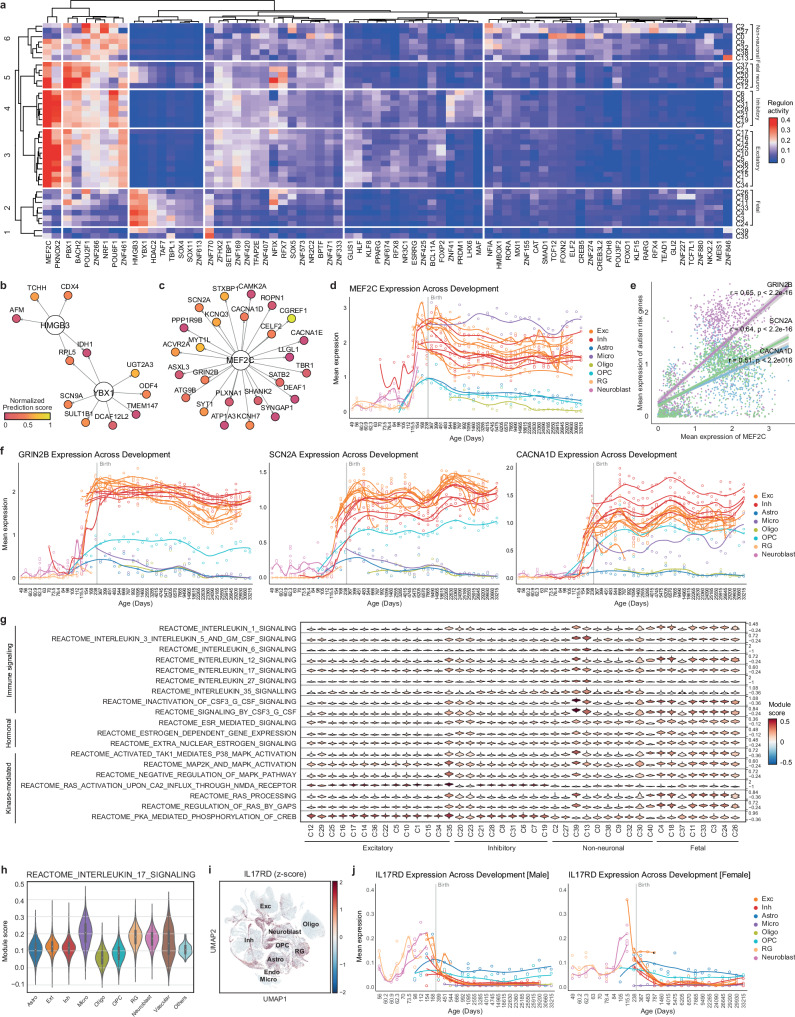
Fig. 4. Regulatory landscape and pathway enrichment in early brain development.
a Heatmap illustrating the regulon activities of transcription factors across clusters. Transcription factor-target networks depicting the regulation of glioblastoma risk genes by HMGB3 and YBX1 (b) and the regulation of autism risk genes by MEF2C (c). Prediction confidence was normalized from 0 to 1. The top 25 high-confidence targets for MEF2C are shown. d Expression of MEF2C over gestational days. The samplewise mean of log-normalized MEF2C expression was computed using a pseudobulk method. Clusters with at least 4,600 cells (C0–C22) were used. e Correlations between the samplewise means of log-normalized MEF2C expression and the expression of GRIN2B, SCN2A, and CACNA1D. f Expression of GRIN2B, SCN2A, and CACNA1D across developmental ages. g Violin plot displaying the pathway module scores as the average expression levels of pathway genes adjusted for control features. h Violin plot of pathway module scores across major cell types. i UMAP visualization of z score-normalized IL17RD expression. j Expression of IL17RD over gestational days, stratified by sex.

