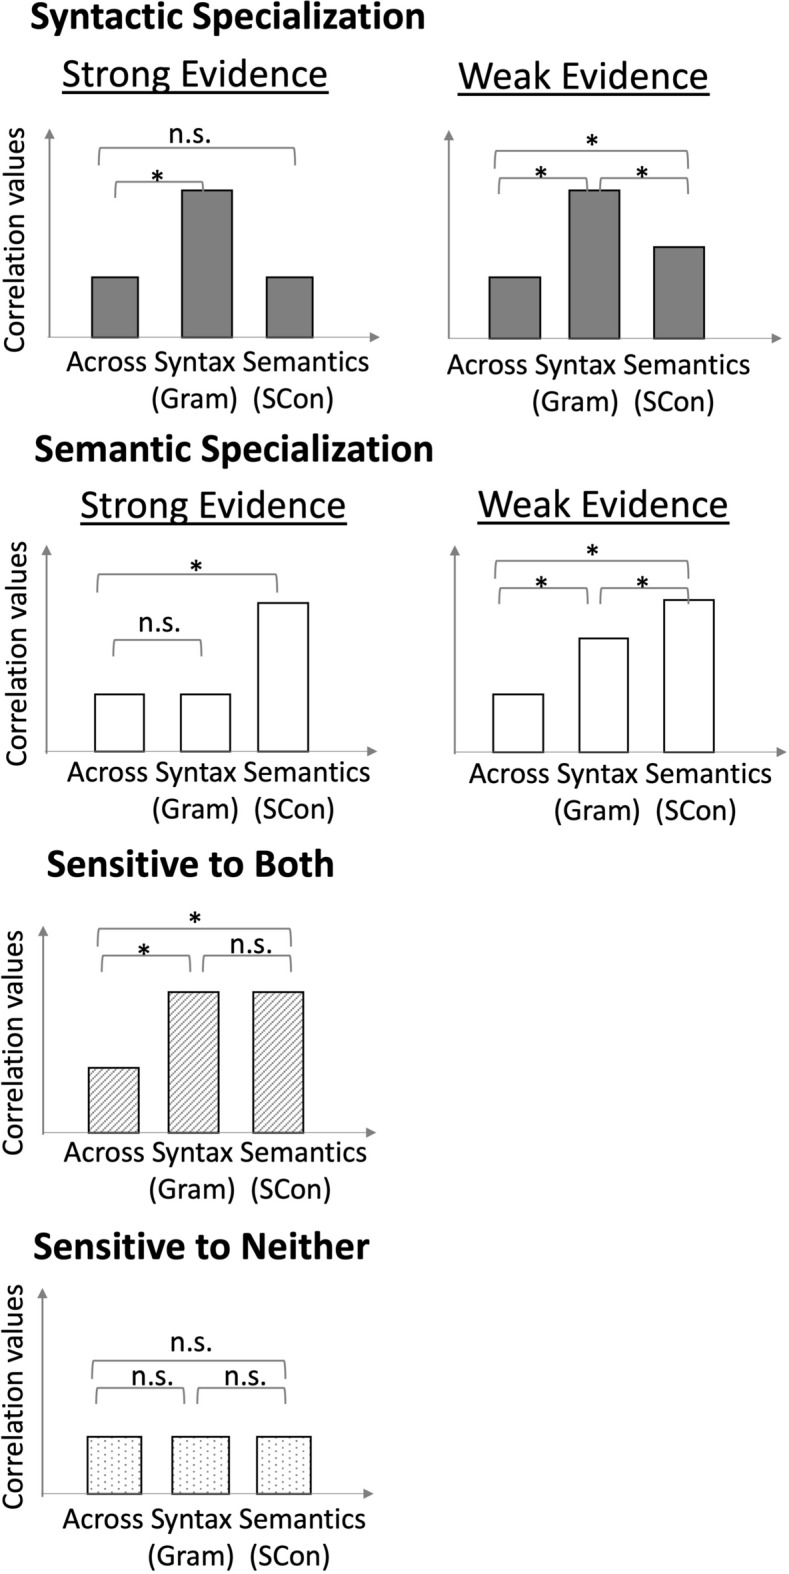
Fig. 2.

Hypotheses of different outcomes in group level analyses. Here we display the outcomes of correct sentences as an example. X axis displays the different types of correlations. Syntax (Gram): the within-syntactic correlations using grammatically correct condition; Semantics (SCon): the within-semantic correlations using strongly congruent condition; Across: across-task correlations. Y axis represents the correlation values calculated from the first level multivoxel pattern analysis. "*" indicates that the two types of correlations differ significantly. "n.s." represents no significant difference. This figure was adapted from Wang, Wagley, Rice, & Booth27.
