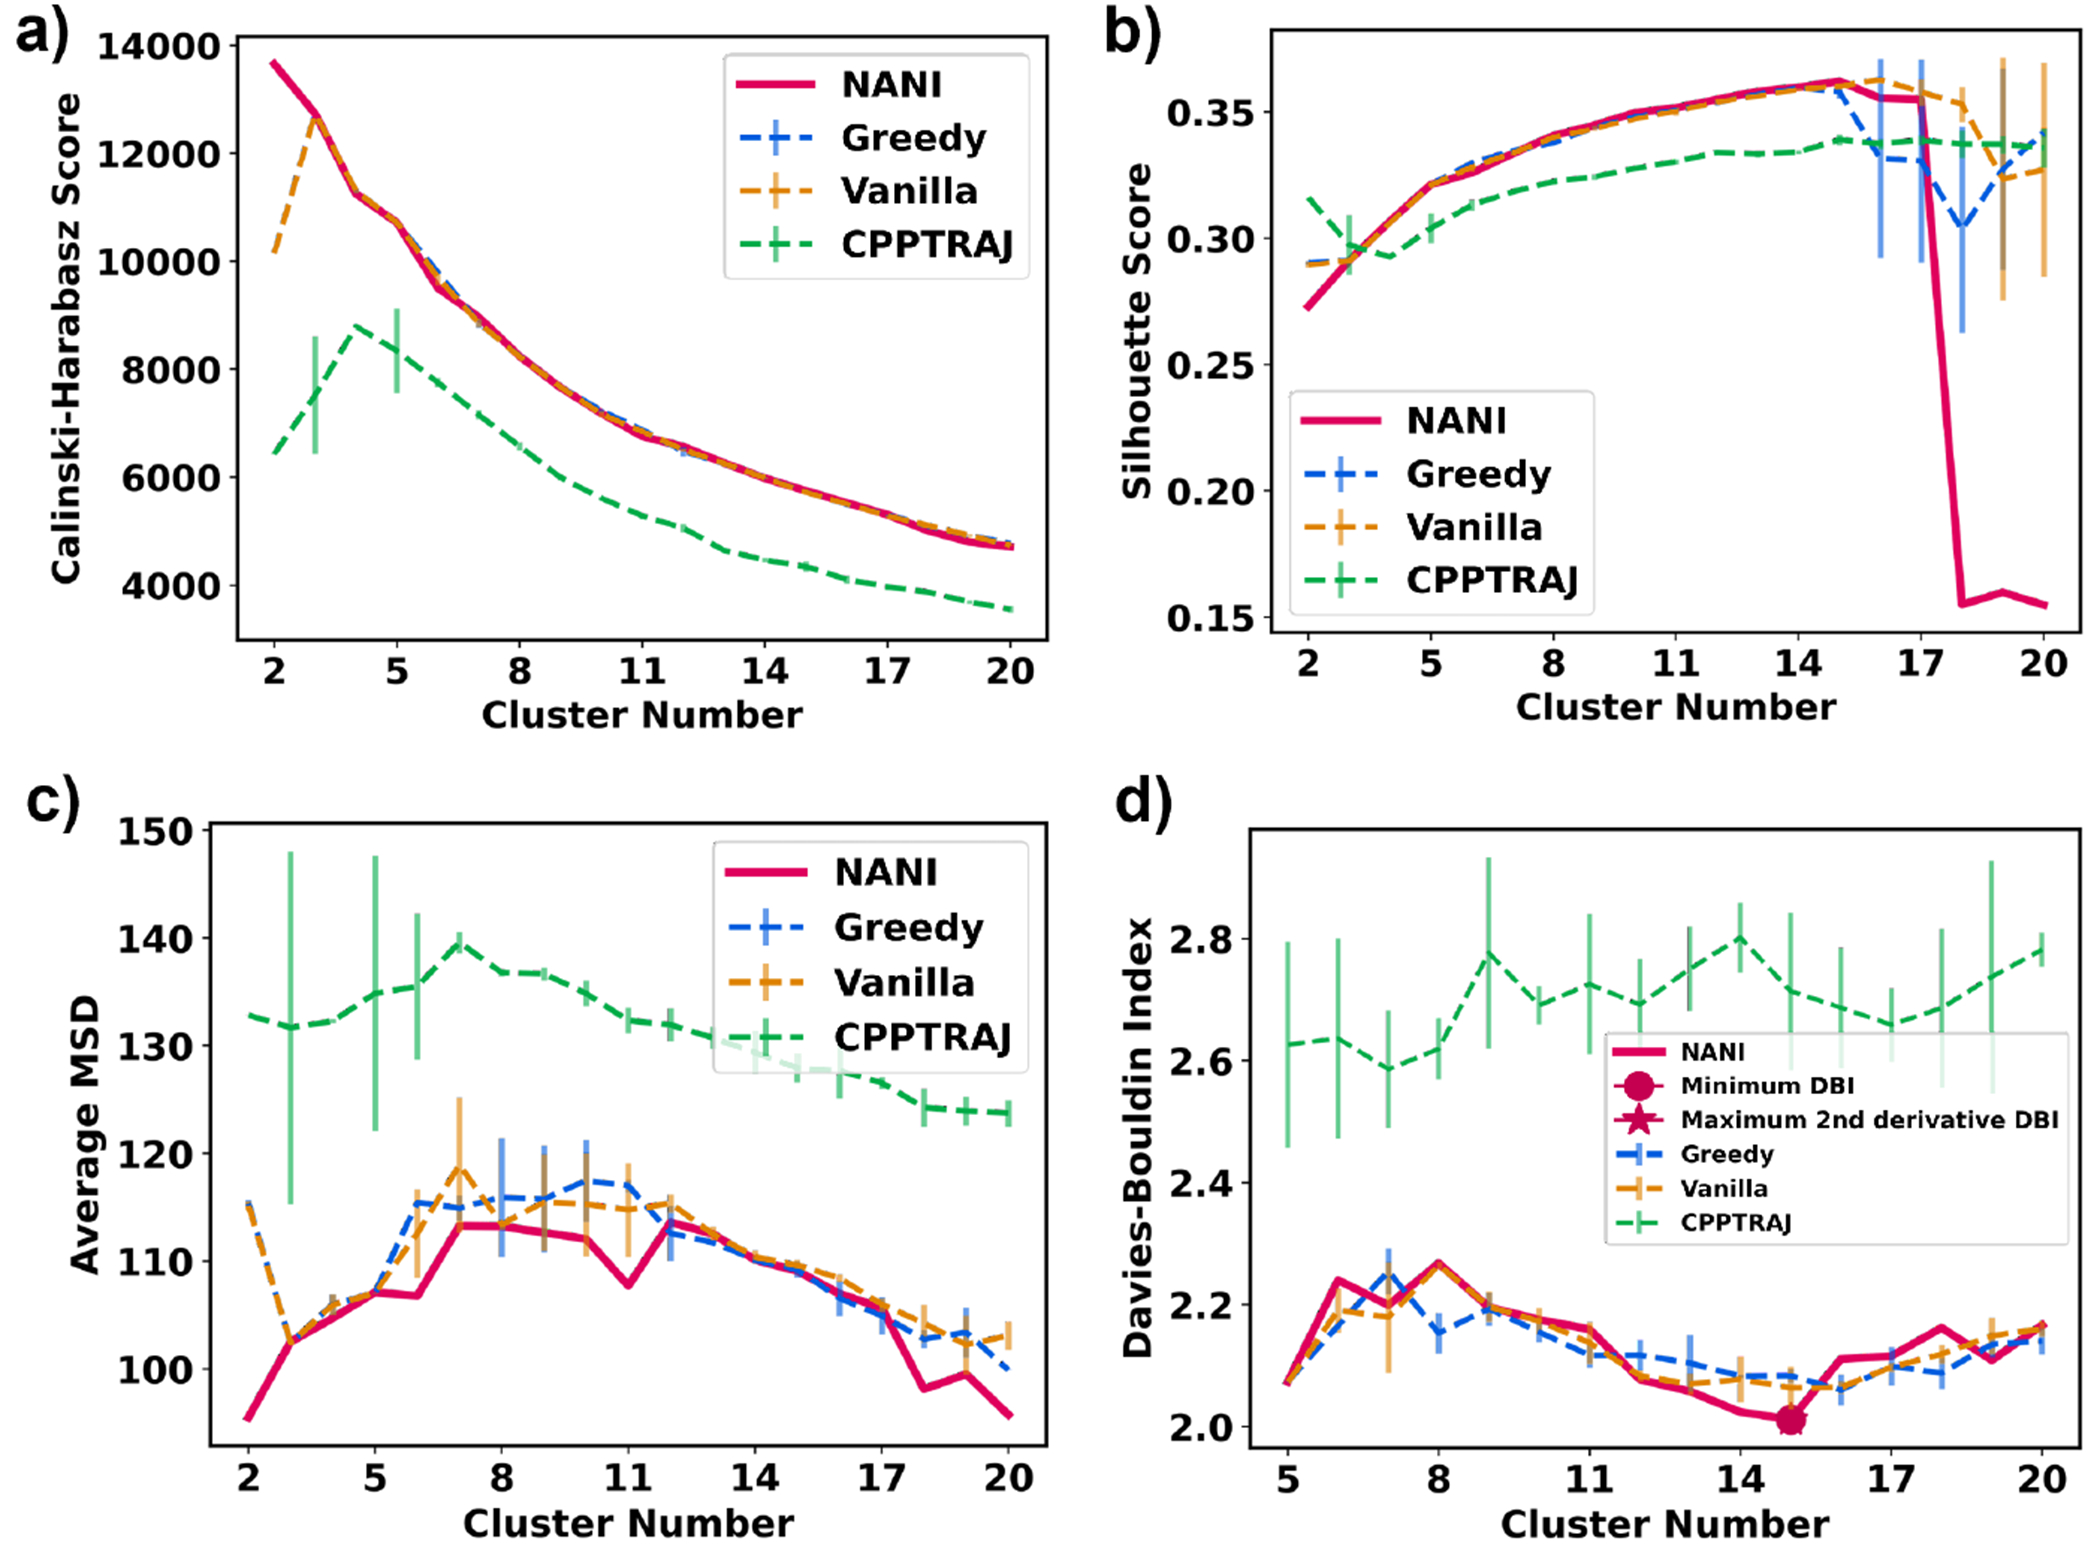
Figure 12:

Indicators of different seed selectors applied on NuG2. Error bars represent the standard deviation over three replicates. All use the single-reference alignment. (a) Calinski-Harabasz index (b) Silhouette score (c) Average mean squared deviation (d) Davies–Bouldin index
