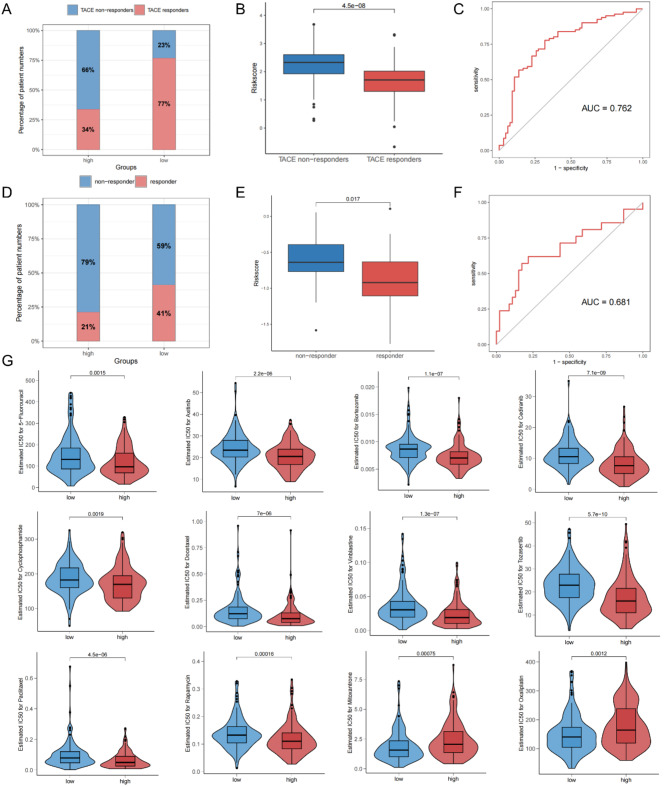
Fig. 8.
Prediction of treatment responses to TACE, sorafenib and chemical drugs by the MIRGPI. (A) Proportion of patients in different risk subgroups who responded to TACE therapy. (B) Risk scores for both the TACE non-responder and TACE responder groups. (C) ROC curves of the MIRGPI predicting the response to TACE therapy. (D) Proportion of patients in different risk subgroups who responded to sorafenib therapy. (E) Risk scores for both the sorafenib non-responder and sorafenib responder groups. (F) ROC curves of the MIRGPI predicting response to sorafenib therapy. (G) Half maximal inhibitory concentration (IC50) values of 5-fluorouracil, axitinib, bortezomib, cediranib, cyclophosphamide, docetaxel, GDC0810, osimertinib, paclitaxel, rapamycin, mitoxantrone, and oxaliplatin in both risk groups.

