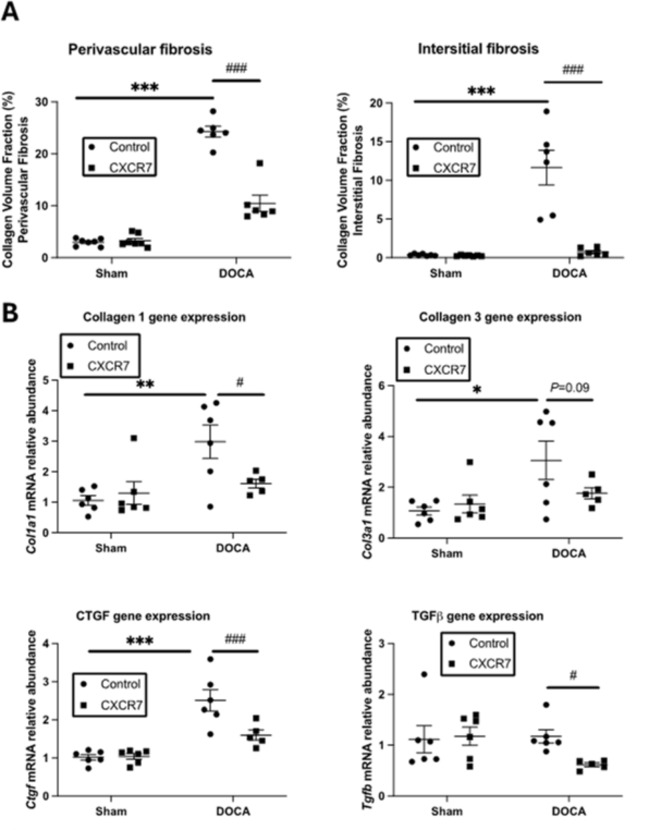
Fig. 3.
Cardiac fibrosis and fibrotic gene expression. (A) Graph representing perivascular and interstitial collagen volume fraction in Control (Sham-operated with isotype injection control) (n = 7), Control + CXCR7 (n = 7), DOCA-UNX (n = 6) and DOCA-UNX + CXCR7 (n = 6) mice. Data are presented as the mean ± SEM. ***P < 0.001 vs. Control. ###P < 0.001 vs. DOCA-UNX. (B) Fibrotic gene expression in the Control (n = 6), Control + CXCR7 (n = 6), DOCA-UNX (n = 6), and DOCA-UNX + CXCR7 mice (n = 5). Data are presented as the mean ± SEM. *P < 0.05, **p < 0.01, ***p < 0.001 vs. control. #P < 0.05, ###p < 0.001 vs. DOCA-UNX.

