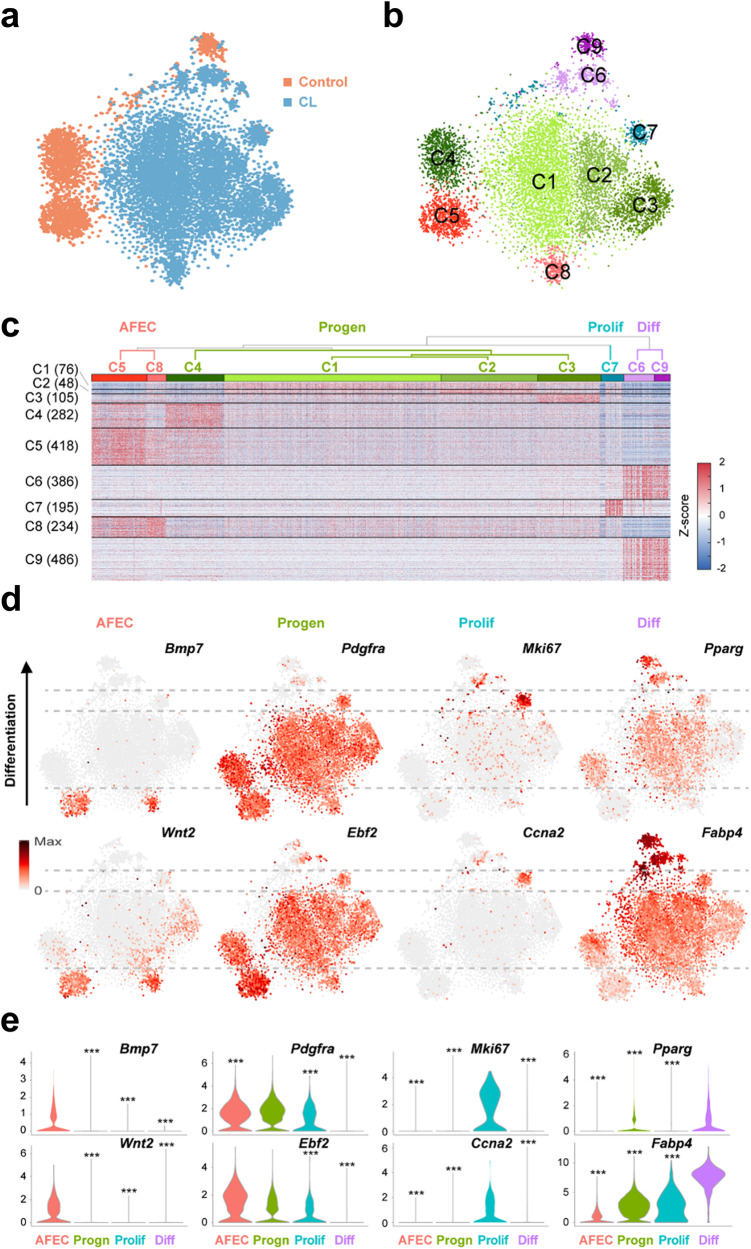
Fig. 2. Cellular heterogeneity of control and CL-treated PDGFRA+ progenitors.
a t-SNE plots of PDGFRA+ cells (dots) obtained from the control (orange, n = 3) and CL-treated (blue, n = 3) cells. b t-SNE plots showing the nine clusters (C1-9) of PDGFRA+ cells. Different colors were used to distinguish the clusters. c Four groups of the nine clusters (AFEC, Progen, Prolif, and Diff). A dendrogram of C1-9 was obtained from hierarchical clustering of the mean expression profiles in C1-9. The heatmap shows the increased (red) and decreased (blue) expression (Z score) of the upregulated genes (rows) in at least one cluster with respect to the median expression across all the samples (columns). The Z score was obtained by the inverse normal distribution of the mRNA expression level and log-normalized molecular count. The numbers of upregulated genes in each cluster are denoted in parentheses. d t-SNE plot showing the expression levels of the indicated representative upregulated genes in the four groups. The color bar represents the gradient of the mRNA expression level, and the same gradient was used for the range between the minimum (zero) and the maximum expression levels of each gene. e Violin plots showing the distributions of the mRNA expression levels of each representative upregulated gene in the four groups. ***P < 0.001 by one-way analysis of variance (ANOVA) with Tukey’s correction.

