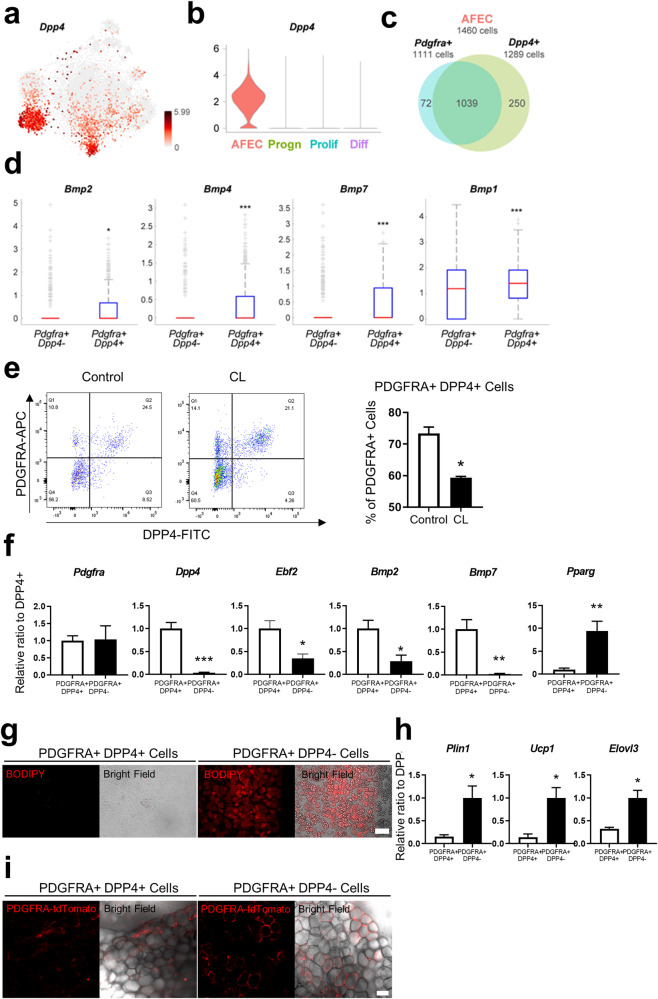
Fig. 3. Non-adipogenic PDGFRA+ and DPP4+ niche cells.
a t-SNE plot showing the mRNA expression level of DPP4 across the cells in the four groups. The color bar represents the gradient of the mRNA expression level. b Violin plot showing the distributions of Dpp4 mRNA expression in the indicated four groups. c Venn diagram showing the relationship between PDGFRA+ (1111 cells) and Dpp4+ cells (1289 cells) in the AFEC group (1460 cells). d Comparison of the mRNA expression levels of the indicated genes between Pdgfra+ Dpp4+ and Pdgfra+ Dpp4- cells. e Flow cytometric analysis of PDGFA and DPP4 expression in SVCs from the iWAT of control mice and mice treated with CL for 3 days. f Relative mRNA expression levels of the indicated genes in PDGFRA+ DPP4+ and PDGFRA+ DPP4− cells isolated from iWAT of mice with respect to the mean level in PDGFRA+ DPP4− cells. g Representative images of PDGFRA+ DPP4+ and PDGFRA+ DPP4− cells cultured under standard adipogenic conditions. Bar = 100 μm. h Relative mRNA expression levels of the indicated genes in PDGFRA+ DPP4+ and PDGFRA+ DPP4− cells cultured under standard adipogenic conditions. i Representative images of Matrigel gels containing PDGFRA+ DPP4+ and PDGFRA+ DPP4− cells 3 weeks after transplantation. Bar = 50 μm. The data were analyzed by an unpaired two-tailed t test (mean ± SEM; n = 3–5; *P < 0.05, **P < 0.01 and ***P < 0.001).

