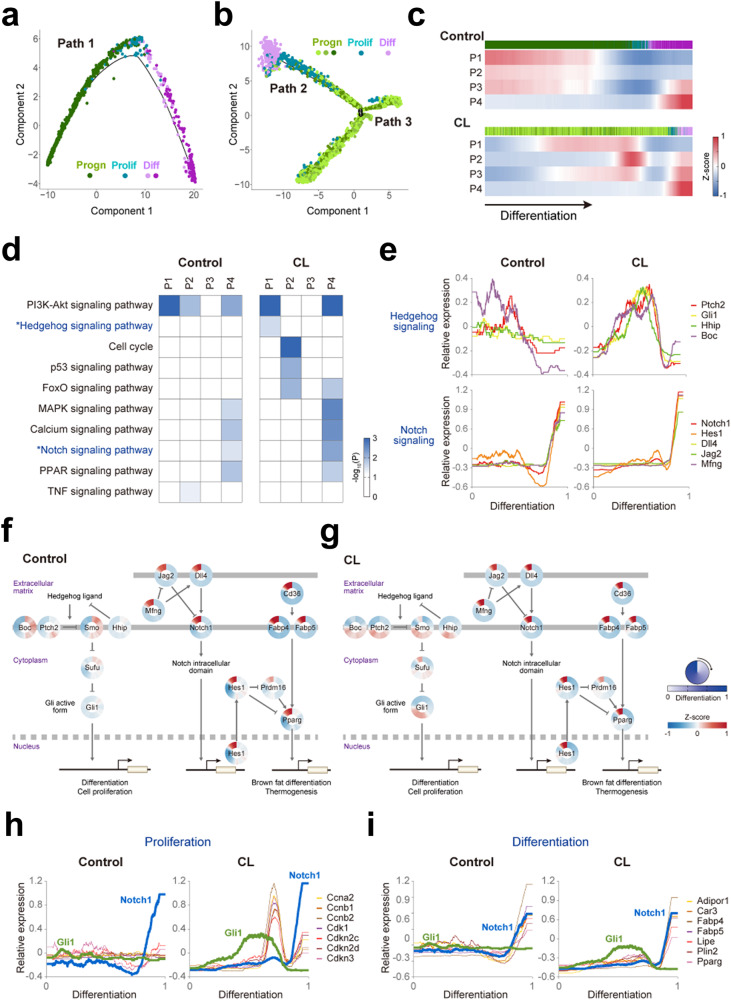
Fig. 4. Serial activation of Hedgehog and Notch signaling during the de novo differentiation of PDGFRA+ cells.
t-SNE plots showing the differentiation trajectories of control (a) and CL-treated (b) PDGFRA+ progenitors. Linear (Path 1) and bifurcating (Paths 2 and 3) trajectories were obtained for control and CL-treated PDGFRA+ progenitors. Different colors are used to distinguish the clusters in the Progen, Prolif, and Diff groups. c Four patterns (P1-4) showing the mean expression (Z score) of genes upregulated early, middle, or late along Path 1 (top) and Path 2 (bottom). The colored bars on the top of the heatmaps denote the cluster memberships of individual PDGFRA+ progenitors in the four groups. The pseudotime along the differentiation trajectory increases along the differentiation axis (arrow). d Signaling pathways enriched by the genes in P1-4 under control or CL treatment conditions. The heatmap shows the enrichment significance defined by –log10(P), where P is the enrichment P value from the EASE test in DAVID. The color bar represents the gradient of –log10(P). e Temporal relative expression profiles of the indicated representative genes involved in Hedgehog (top) and Notch signaling (bottom) during differentiation under control (left) and CL treatment (right) conditions. Relative expression profiles were obtained as described in the Materials and Methods section. Network models showing serial activation of Hedgehog and Notch signaling under control (f) and CL treatment conditions (g). The circular heatmap represents the increased (red) or decreased (blue) relative expression (Z score) of the indicated genes in the two pathways during differentiation (top legend). The color bar shows the gradient of the Z score. Arrows and suppression symbols represent activation and inhibition, respectively, of signaling reactions. The thick solid and dotted lines denote the plasma and nuclear membranes, respectively. The binding of translocalized transcription factors to the promoters of target genes is also shown. Temporal relative expression profiles of the indicated representative genes related to proliferation (h) and differentiation (i) under control (left) and CL treatment (right) conditions. The expression profiles of Gli1 and Notch1 are included as references.

