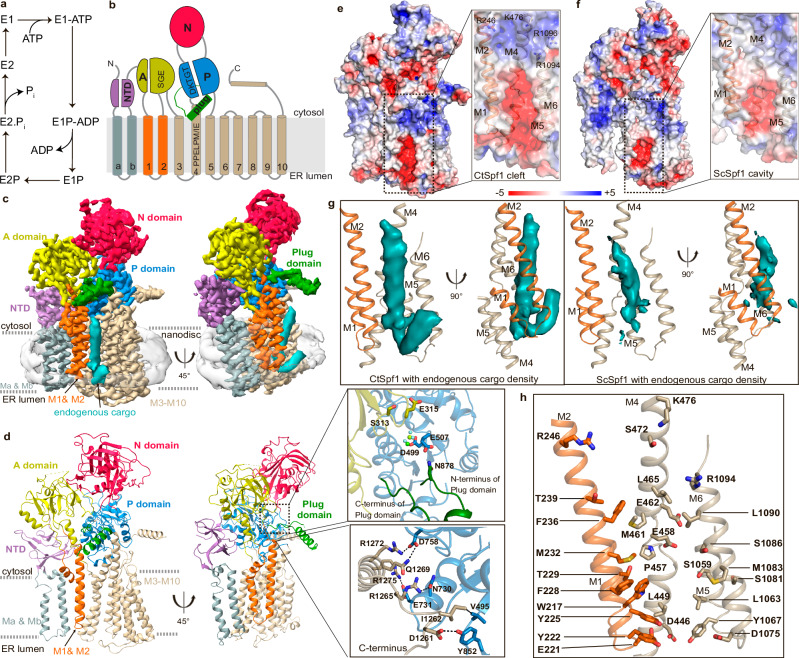
Fig. 1. Overall architecture of the P5A-ATPase CtSpf1 in the E2P state with bound endogenous cargo.
Note the cargo helix is not modeled in E2P, and hence the cleft appears more exposed than it is in the structure. a The P-type ATPase transport cycle follows the E1–E1P–E2P–E2 post-Albers scheme. b P5A-ATPase topology with the A- (colored yellow), P- (blue), N- (red), M- (helices Ma/Mb in gray, M1/M2 in orange and M3-M10 in wheat), NTD- (purple) and Plug- (green) domains. c 3.5 Å global resolution cryo-EM map, colored as in panel (b), with a co-purified polypeptide (cyan, non-sharpened) and nanodisc (transparent gray). d Cartoon representation, colored as in panel a, and in the same view as panel (c). Close-view of the interaction of the P-domain insertion with the P-domain and SGE dephosphorylation of the A-domain (upper panel); and close-view of the interaction of the C-terminus with the P-domain (lower panel). e Surface electrostatics of CtSpf1, with a close view of the cleft spanning the entire ER membrane formed primarily by M1, M2, M4, and M6. f Equivalent surface electrostatics for ScSpf1 (PDB-ID 6XMT23), with a cavity facing the ER lumen. g Uncropped cryo-EM density (cyan, left panel) of the cargo helix associated with the M-domain cleft CtSpf1, and the equivalent for the cavity present in ScSpf1 (cyan, left panel, EMD: 22264). h Manually selected residues that may interact with the cargo. Residues highlighted in bold are conserved among P5A-ATPases.

