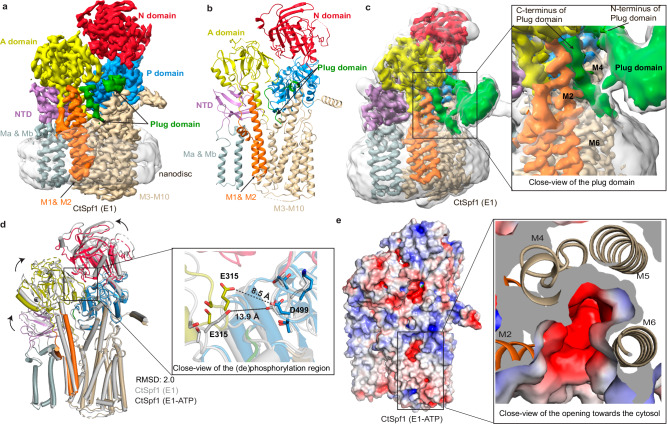
Fig. 3. The blocked cytosol-facing apo E1 and E1-ATP states.
a 3.4 Å global resolution cryo-EM map of the E1 structure, colored as in Fig. 1b. b Cartoon representation of the E1 state. c The Plug-domain (green) dips into and blocks the cytosol-facing cavity, inserted in between M2 and M4. Non-sharpened, Cryo-EM map (gray, transparent) at contour level 0.13, and non-sharpened density for the Plug-domain (green) at contour level 0.16. d Structural comparison of the apo E1 (gray) and E1-ATP states (colored domains) highlighting the movement of the SGE dephosphorylation loop. e Surface electrostatics of the E1-ATP state, with a deep cavity in the M-domain that is exposed to cytosol, unless blocked by the Plug-domain, which is not modeled. The close view is from the cytosol, showing that the cavity is lined by M2, M4, M5, and M6.

