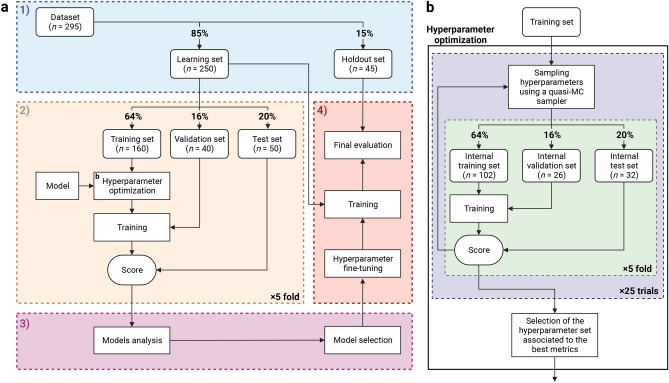
Fig. 8.
Experimental setup74. (a) Overview of the model selection process. 1) Stratified division of the dataset into a learning set and a holdout set. See Supplementary Fig. 17 & 18 and Supplementary Tables 9 & 10 for visual and statistical comparison between the two generated sets. Stratification is based on LNI class labels and BCR-FS event indicators. 2) Evaluation of the models on 5 test sets using stratified 5-fold cross-validation. 3) Comparison and selection of the models based on performance and interpretability. The performance is measured using the mean and standard deviation of the scores on the 5 test sets. 4) Final evaluation of the selected model on the holdout set. (b) Detailed diagram of the Hyperparameter optimization box shown in section 2 of panel a. Hyperparameter optimization is performed automatically using the quasi-Monte Carlo (MC) sampler from the BoTorch75 Python library, which is used under the framework of the Optuna76 Python library. A total of 25 sets of hyperparameter values are sequentially sampled using the quasi-MC sampler and evaluated on the same 5 internal test sets. The performance is measured using the mean of the scores on the 5 internal test sets. The first 5 sets of hyperparameter values are randomly generated, while the subsequent ones are determined based on the performance score of the preceding sets. The set of hyperparameter values associated to the highest AUC (for classification tasks) or CI (for survival tasks) is selected. See Supplementary Tables 11–17 for hyperparameter search spaces and Supplementary Tables 18–20 for selected hyperparameter values. Created in BioRender. Larose, M. (2024) https://BioRender.com/n79f502.

