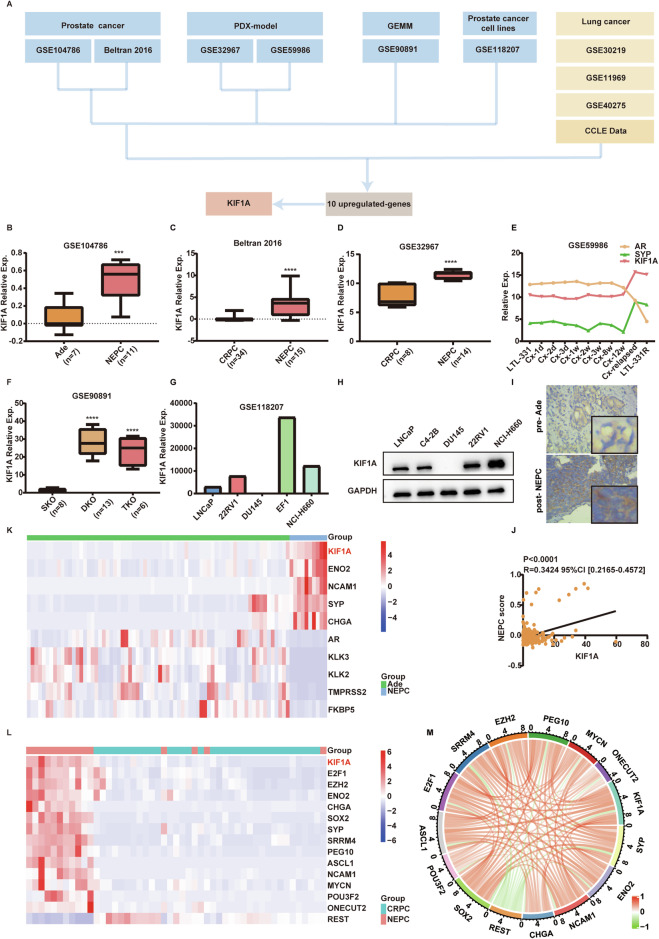
Fig. 1. KIF1A overexpression is associated with NE phenotype.
A A summary of dataset integration and the pipeline for putative driver gene selection. B, C Expression of KIF1A in NEPC patient samples compared with CRPC or Ade in GSE104786, Beltran 2016 dataset. D Expression of KIF1A in NEPC PDX models compared with CRPC. E Expressions of KIF1A, AR, and SYP during the transformation from Ade (LTL331) to NEPC (LTL331R) after castration in GSE59986 dataset. F Expressions of KIF1A in different GEMMs in GSE90891 dataset. G The expressions of KIF1A across different PCa cell lines in GSE118207 dataset. H KIF1A protein levels in LNCaP, C4-2B, DU145, 22RV1 or NCI-H660 cells. I Representative images showing immunohistochemistry staining for KIF1A in Ade and NEPC cases. J The Pearson’s r correlation coefficient between KIF1A and NEPC score in SU2C 2019 cohort. NEPC score was calculated as described previously [24]. K Heatmap showing expression of KIF1A, AR signal pathway and NE associated genes in GSE126078 dataset. L Heatmap showing expression of KIF1A and NE associated genes in Beltran 2016 cohort. M Circos plot displaying the interconnectivity among NE associated genes and KIF1A. The thickness and color of the strip indicated the correlation coefficient in Beltran 2016 cohort. All results were presented as the mean ± SD. ***p <0.001, ****p <0.0001, based on Student’s t test. PDX patient-derived xenograft, GEMM genetically engineered mouse model, Ade adenocarcinoma.

