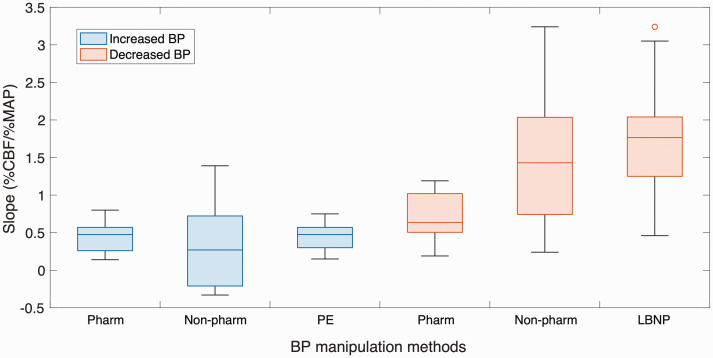
Figure 4.
Slope distribution of different blood pressure manipulation methods. Experiments inducing BP increase are represented by blue boxplots, while experiments inducing BP decrease are represented by orange boxplots. Non-pharm, non-pharmacological BP manipulation methods; Pharm, pharmacological BP manipulation methods; PE, phenylephrine; LBNP, lower body negative pressure.

