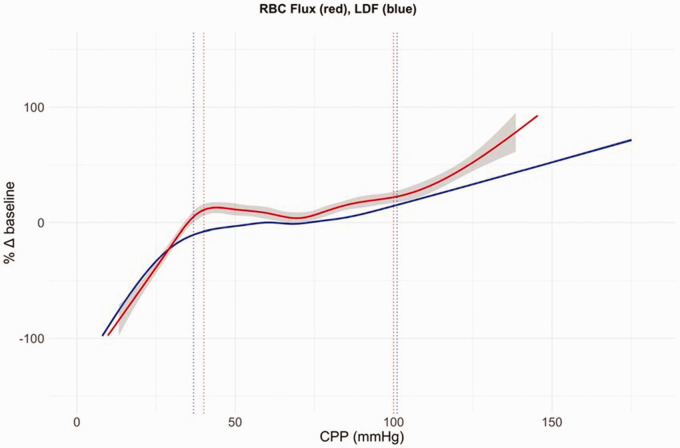
Figure 1.
Autoregulatory curve. Autoregulation curve combined changes in LDF (laser doppler flow) (blue) and RBC (red blood cells) flux (red) for 10 hypotensive and 10 hypertensive piglet experiments plotted against CPP. Grey shading represents the standard error (for the LDF data curve there was no visible standard error). Dotted lines show the mean lower and upper limits of autoregulation. 27

