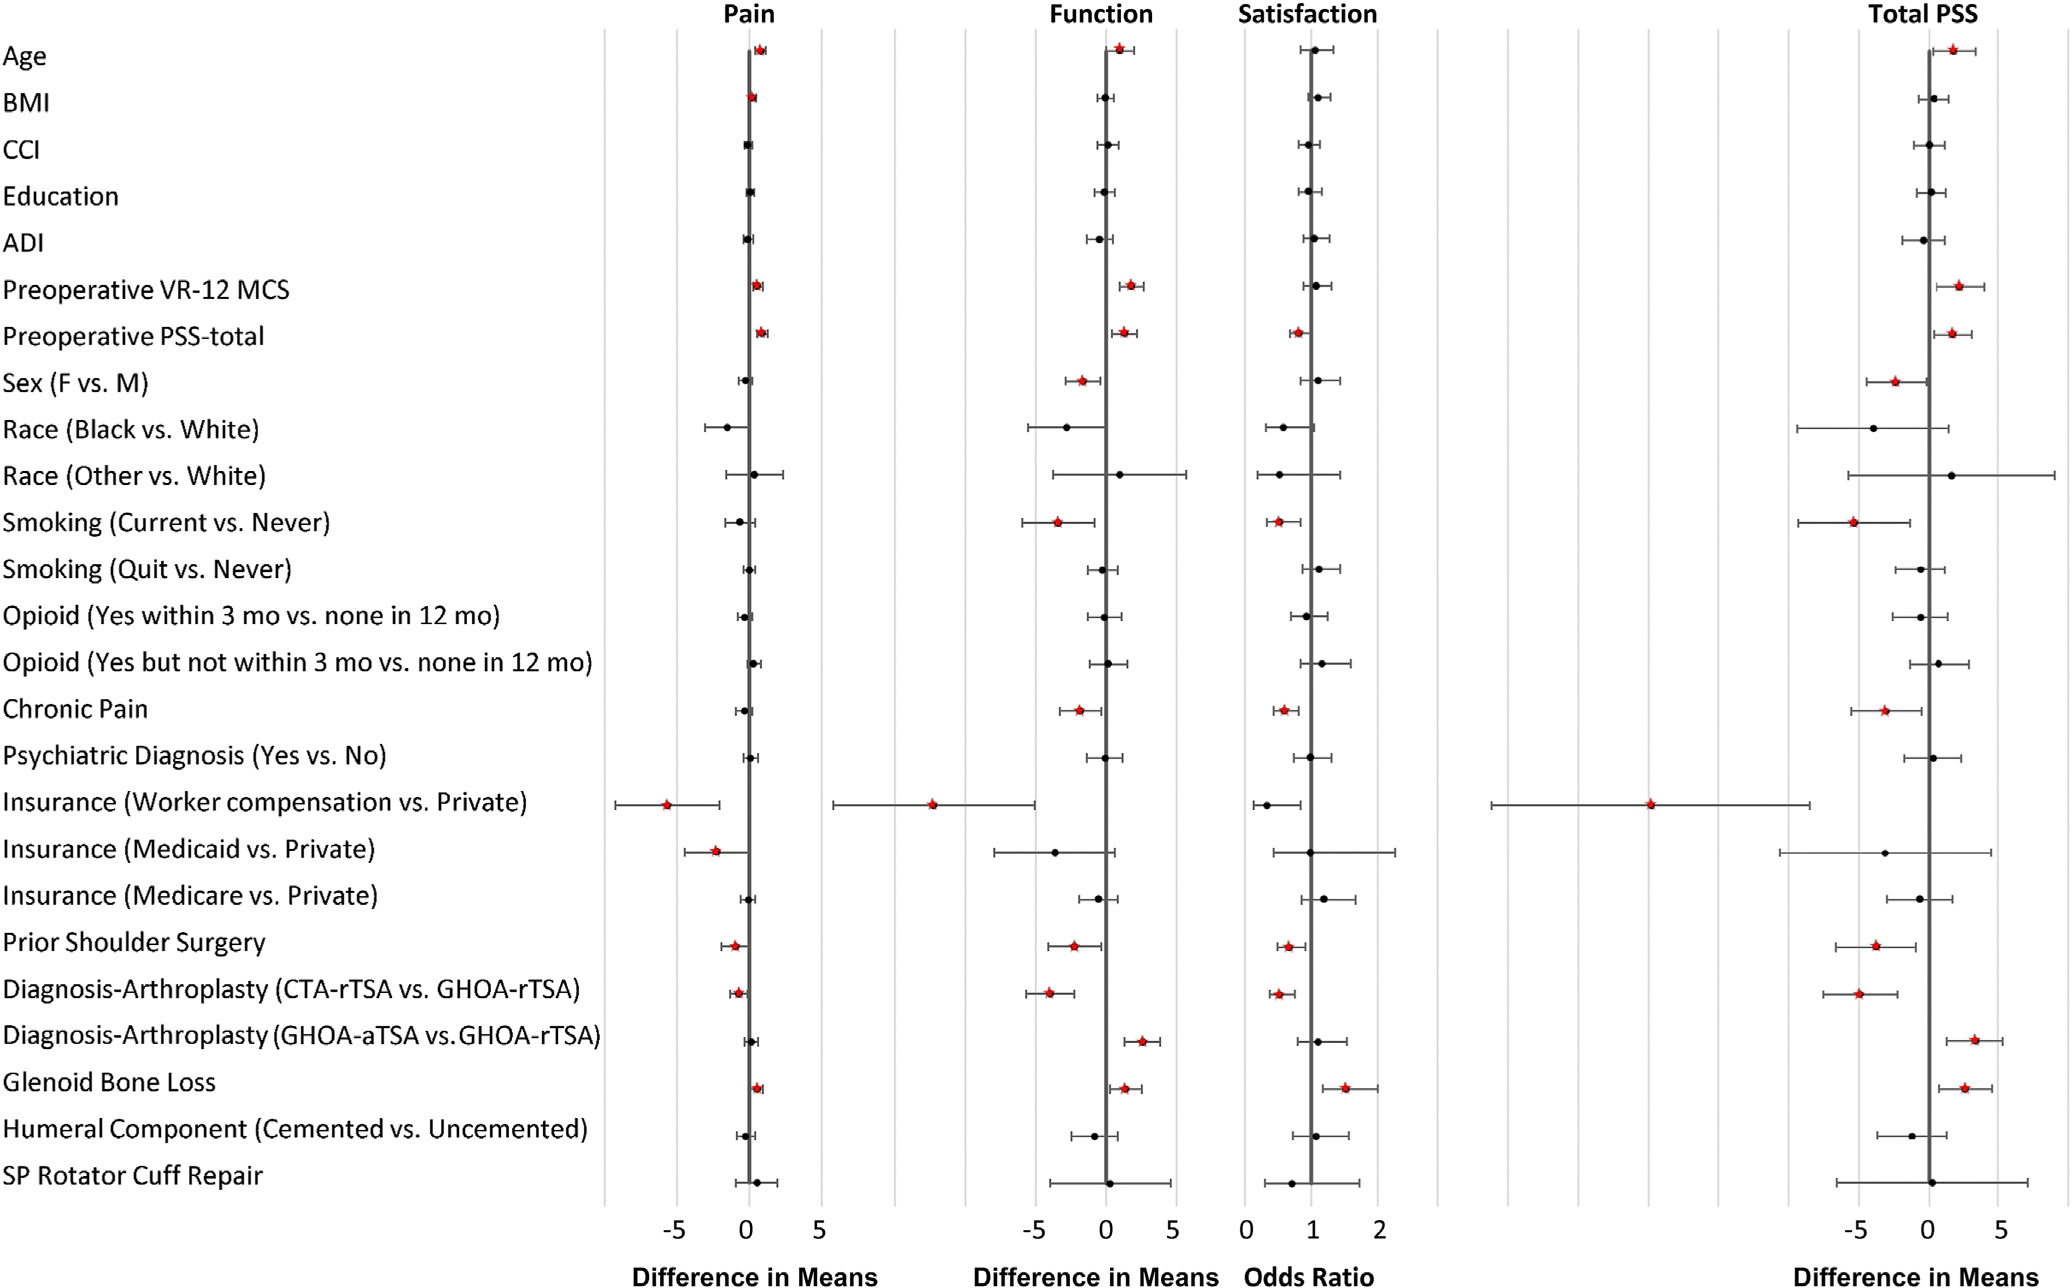
Figure 2.

Forest plot showing the estimated difference in means for pain and function subscores and total PENN Shoulder Score (PSS) and odds ratios for the satisfaction subscore, each with 95% confidence intervals, for predictors in the full models of patients undergoing primary shoulder arthroplasty. The effects for continuous variables (age, BMI, CCI, education, ADI, baseline VR-12 MCS, and baseline PSS) are comparing the 75th vs. 25th percentiles shown in Table II. Predictors or contrasts of categories of categorical predictors are regarded as statistically significant, and their respective estimated effect sizes are depicted in red, only if the corresponding overall test simultaneously assessing associations of all categories with the respective 1-year PSS score or subscore is statistically significant. BMI, body mass index; CCI, Charlson Comorbidity Index; ADI, Area Deprivation Index; VR-12 MCS, Veterans RAND 12-Item Health Survey mental component summary; F, female; M, male; CTA, cuff tear arthropathy; rTSA, reverse total shoulder arthroplasty; GHOA, glenohumeral osteoarthritis; aTSA, anatomic total shoulder arthroplasty; SP, superior-posterior.
