
Figure 1.
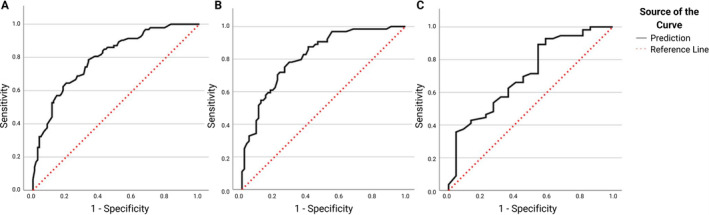
Receiving operator characteristic (ROC) curves for visit 1 at baseline (A), visit 2 at 2 years (B) and visit 3 at 4 years (C). The dotted red line indicates an area under the curve (AUC) of 0.5, representing a non‐informative model.
Official websites use .gov
A
.gov website belongs to an official
government organization in the United States.
Secure .gov websites use HTTPS
A lock (
) or https:// means you've safely
connected to the .gov website. Share sensitive
information only on official, secure websites.
Receiving operator characteristic (ROC) curves for visit 1 at baseline (A), visit 2 at 2 years (B) and visit 3 at 4 years (C). The dotted red line indicates an area under the curve (AUC) of 0.5, representing a non‐informative model.