
Figure 2.
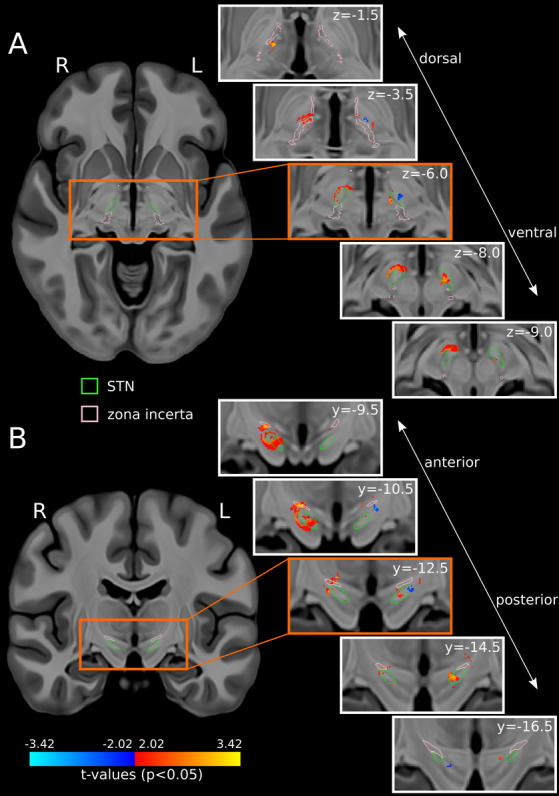
Voxels associated with gait velocity changes when stimulated (P < 0.05, uncorrected) are projected on high‐resolution T1‐weighted template slices (A: axial, B: coronal). 10 Warm colors: Faster gait velocity. Cool colors: Slower gait velocity. Green outlines: STN. Pink outlines: Zona incerta.