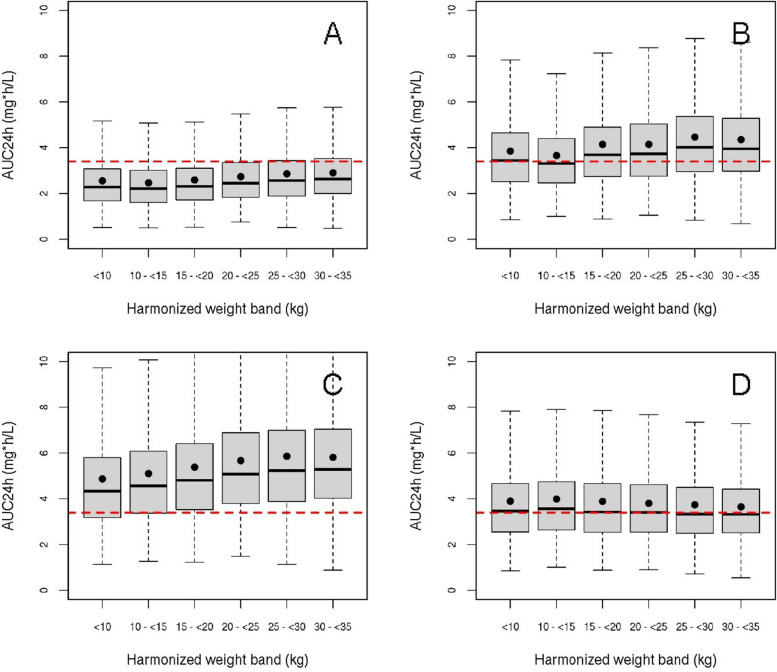
Fig. 3.
Comparison of pharmacokinetic parameters from conventional and allometric dosing regimens. Achieved exposure, reported as AUC0-24 h on the third day of treatment, using different dosing regimens. The red dashed line indicates the mean exposure level of 3.45 mg*h/L in adults, that is used as a reference (25). The solid dots indicate the mean AUC0-24 h resulting from the simulation. The boxes represent the predicted interquartile range and the solid black line represents the predicted median. The whiskers depict the extremes. A 10 mg/kg body weight; B 15 mg/kg body weight; C 20 mg/kg body weight; D allometric dosing, consisting of a flat dose per weight band according to Table 5. This dosing scheme results in a consistent exposure across all weight bands

